{
"type": "modal",
"contentType": "images",
"content": {
"title": "",
"images": ["//humehealth.com/cdn/shop/files/Modal_Always_Eligible.svg?v=1765544261&width=2000"]
},
"width": 750,
"transitionDuration": 150
}
{
"type": "slideout",
"contentType": "with_image",
"content": {
"title": "","image": "//humehealth.com/cdn/shop/files/10years.webp?v=1763051337&width=900",
"imageWidth": "200","imageContent": "\u003ch3\u003eAbout warranty\u003c\/h3\u003e\u003cp\u003eYou're investing in a decade of health tracking. The 10-Year Warranty gives your device the same long-term protection and ensures it stays covered and performing at its best for your entire journey ahead.\u003c\/p\u003e",
"secondaryContent": "\u003ch4\u003eComplete hardware and sensor coverage\u003c\/h4\u003e\u003cp\u003eEvery component of your device is protected for 10 years. This includes not just the device shell but all the advanced sensors that power your health insights. If anything goes wrong with the hardware or sensing technology, you're fully covered.\u003c\/p\u003e\u003ch4\u003eReliable accuracy, guaranteed\u003c\/h4\u003e\u003cp\u003ePrecision is what drives reliable health insights. With on-request servicing included, you can maintain that measurement quality throughout the entire decade. If you ever notice accuracy drift or want recalibration, just request service and we'll ensure your device is performing like new.\u003c\/p\u003e\u003ch4\u003eOne-time checkout pricing\u003c\/h4\u003e\u003cp\u003eThis discounted rate is only available now. Add the 10-Year Warranty at checkout for $46, or pay the full $70 if you decide to add it later. Lock in the best price today and never think about coverage again.\u003c\/p\u003e"
},
"width": 750,
"transitionDuration": 700
}
{
"type": "slideout",
"contentType": "images",
"content": {
"title": "",
"images": ["//humehealth.com/cdn/shop/files/accuracy_report_1.webp?v=1763137586&width=1785","//humehealth.com/cdn/shop/files/accuracy_report_2_0a60d4d8-95ee-4abc-a50d-9d0472a18b18.webp?v=1763137911&width=1785","//humehealth.com/cdn/shop/files/accuracy_report_3_476bfdf8-3500-41cc-95e8-4a1a15f0012e.webp?v=1763137922&width=1785"]
},
"width": 750,
"transitionDuration": 150
}
{
"type": "slideout",
"contentType": "images",
"content": {
"title": "",
"images": ["//humehealth.com/cdn/shop/files/image_21.png?v=1789045503&width=1785","//humehealth.com/cdn/shop/files/image_22_a65002be-36e5-42fb-82b3-b0646c31928b.png?v=1789045518&width=1785"]
},
"width": 750,
"transitionDuration": 150
}
{
"type": "modal",
"contentType": "video",
"content": {
"title": "",
"video": "https://cdn.shopify.com/videos/c/o/v/85f4f6c396ad42bca85df3c9968fe377.mp4",
"autoplay": true
},
"width": 1024,
"transitionDuration": 700
}
{
"type": "slideout",
"content": {
"title": "45-Metric List",
"content": "\u003cp\u003e\u003cstrong\u003eCore totals (20)\u003c\/strong\u003e\u003c\/p\u003e\u003col\u003e\u003cli\u003eWeight\u003c\/li\u003e\u003cli\u003eBMI\u003c\/li\u003e\u003cli\u003eBody Fat Rate (aka body fat %)\u003c\/li\u003e\u003cli\u003eBody Fat Percentage\u003c\/li\u003e\u003cli\u003eFat Mass\u003c\/li\u003e\u003cli\u003eMuscle Mass\u003c\/li\u003e\u003cli\u003eSkeletal Muscle Mass\u003c\/li\u003e\u003cli\u003eMuscle vs Fat Ratio\u003c\/li\u003e\u003cli\u003eVisceral Fat\u003c\/li\u003e\u003cli\u003eMetabolic Age\u003c\/li\u003e\u003cli\u003eBasal Metabolic Rate (BMR)\u003c\/li\u003e\u003cli\u003eHydration (status\/level)\u003c\/li\u003e\u003cli\u003eWater Weight\u003c\/li\u003e\u003cli\u003eTotal Body Water (TBW)\u003c\/li\u003e\u003cli\u003eIntracellular Water (ICW)\u003c\/li\u003e\u003cli\u003eExtracellular Water (ECW)\u003c\/li\u003e\u003cli\u003eProtein Levels\u003c\/li\u003e\u003cli\u003eBone mineral content \/ “bone” metric (often marketed as bone density)\u003c\/li\u003e\u003cli\u003eHeart health \u003c\/li\u003e\u003cli\u003eFull-body segmental scan coverage (arms\/torso\/legs)\u003cbr\/\u003e\u003c\/li\u003e\u003c\/ol\u003e\u003cp\u003e\u003c\/p\u003e\u003cp\u003e\u003cstrong\u003eSegmental fat % (5)\u003c\/strong\u003e\u003c\/p\u003e\u003col\u003e\u003cli\u003eRight Arm Fat %\u003c\/li\u003e\u003cli\u003eLeft Arm Fat %\u003c\/li\u003e\u003cli\u003eTrunk Fat %\u003c\/li\u003e\u003cli\u003eRight Leg Fat %\u003c\/li\u003e\u003cli\u003eLeft Leg Fat %\u003cbr\/\u003e\u003c\/li\u003e\u003c\/ol\u003e\u003cp\u003e\u003c\/p\u003e\u003cp\u003e\u003cstrong\u003eSegmental muscle\/lean outputs (5)\u003cbr\/\u003e\u003c\/strong\u003e\u003c\/p\u003e\u003col\u003e\u003cli\u003eRight Arm Muscle\/Lean (segmental)\u003c\/li\u003e\u003cli\u003eLeft Arm Muscle\/Lean (segmental)\u003c\/li\u003e\u003cli\u003eTrunk Muscle\/Lean (segmental)\u003c\/li\u003e\u003cli\u003eRight Leg Muscle\/Lean (segmental)\u003c\/li\u003e\u003cli\u003eLeft Leg Muscle\/Lean (segmental)\u003c\/li\u003e\u003c\/ol\u003e\u003cp\u003e\u003c\/p\u003e\u003cp\u003e\u003cstrong\u003eSegmental muscle\/water balance ratings (5)\u003cbr\/\u003e\u003c\/strong\u003e\u003c\/p\u003e\u003col\u003e\u003cli\u003eRight Arm Muscle\/Water Balance %\u003c\/li\u003e\u003cli\u003eLeft Arm Muscle\/Water Balance %\u003c\/li\u003e\u003cli\u003eTorso Muscle\/Water Balance %\u003c\/li\u003e\u003cli\u003eRight Leg Muscle\/Water Balance %\u003c\/li\u003e\u003cli\u003eLeft Leg Muscle\/Water Balance %\u003c\/li\u003e\u003c\/ol\u003e\u003cp\u003e\u003c\/p\u003e\u003cp\u003e\u003cstrong\u003eSegmental intracellular-water health (5)\u003cbr\/\u003e\u003c\/strong\u003e\u003c\/p\u003e\u003col\u003e\u003cli\u003eRight Arm ICW health (segmental)\u003c\/li\u003e\u003cli\u003eLeft Arm ICW health (segmental)\u003c\/li\u003e\u003cli\u003eTorso ICW health (segmental)\u003c\/li\u003e\u003cli\u003eRight Leg ICW health (segmental)\u003c\/li\u003e\u003cli\u003eLeft Leg ICW health (segmental)\u003c\/li\u003e\u003c\/ol\u003e\u003cp\u003e\u003c\/p\u003e\u003cp\u003e\u003cstrong\u003eScoring + insights shown in creative (5)\u003cbr\/\u003e\u003c\/strong\u003e\u003c\/p\u003e\u003col\u003e\u003cli\u003eOverall Health Score\u003c\/li\u003e\u003cli\u003eBody Composition Grade\u003c\/li\u003e\u003cli\u003eActivity Grade\u003c\/li\u003e\u003cli\u003eSleep Grade\u003c\/li\u003e\u003cli\u003eRight-vs-left limb difference flag (lean\/muscle asymmetry callout)\u003cbr\/\u003e\u003c\/li\u003e\u003c\/ol\u003e"
},
"width": 750,
"transitionDuration": 150
}
{
"type": "slideout",
"content": {
"title": "11-modal",
"content": "\u003ch4\u003eLean Mass Preservation During GLP‑1-Assisted Weight Loss in Engaged Digital Health Program Participants\u003c\/h4\u003e\n\u003cp\u003e\u003ci\u003eAn Outcomes Analysis of 6,990 Hume Health Premium Members\n \u003c\/i\u003e\u003c\/p\u003e\n\u003cp\u003eHume Health Corp • Internal Outcomes Analysis • 2024\n Correspondence: research@humehealth.com • Methodology available on request\n\u003c\/p\u003e\n\u003ch4\u003eABSTRACT\u003c\/h4\u003e\n\u003cp\u003e\u003cb\u003eBackground.\u003c\/b\u003e GLP‑1 receptor agonists produce substantial weight loss but are associated with lean mass loss of\n 25–39%\n of total weight lost in published clinical trials. Lean mass is a primary determinant of resting metabolic rate, and\n its loss during weight reduction is associated with impaired weight maintenance following treatment cessation. This\n analysis examined lean mass outcomes in a real-world cohort of Hume Health premium platform members who met defined\n engagement criteria.\u003c\/p\u003e\n\u003cp\u003e\u003cb\u003eMethods.\u003c\/b\u003e Retrospective analysis of 6,990 Hume Health premium members on GLP‑1 therapy who completed a minimum\n of\n three body composition measurements per week via the Hume Body (8-sensor bioelectrical impedance analysis) and made\n weekly attestations of adherence to Pro.f AI protocol guidance. Body composition was measured at each weigh-in. The\n primary outcome was lean mass loss as a percentage of total weight lost, assessed from highest recorded weight (peak)\n to lowest recorded weight (nadir). Weighted mean lean mass loss was computed as the ratio of aggregate lean mass\n change to aggregate total weight lost across the full cohort.\u003c\/p\u003e\n\u003cp\u003e\u003cb\u003eResults.\u003c\/b\u003e Mean baseline weight was 105.3 kg (SD 21.8). Mean total weight lost was 21.9 kg (SD 6.8),\n representing 21.3%\n of baseline body weight. The weighted mean lean mass loss as a percentage of total weight lost was 16.9%. The median\n lean mass loss as a percentage of total weight lost was 19.4%. A total of 12.7% of members preserved or increased lean\n mass over the measurement period. Among the 87.3% of members who lost lean mass, mean lean mass loss as a percentage\n of total weight lost was 22.0%.\n\u003c\/p\u003e\n\u003cp\u003e\u003cb\u003e\n Conclusions. \u003c\/b\u003e Hume Health premium members on GLP‑1 therapy demonstrated lean mass loss substantially below the\n 25–39%\n range documented in published clinical trials. These results are consistent with the hypothesis that\n high-frequency\n body composition monitoring combined with AI-guided protocol adherence supports favorable body composition\n outcomes\n during medically assisted weight loss.\u003c\/p\u003e\n\u003cp\u003e\u003cb\u003eKeywords:\u003c\/b\u003e \u003ci\u003eGLP‑1 receptor agonists; lean mass preservation; body composition; semaglutide; weight loss;\n bioelectrical impedance analysis; digital health\u003c\/i\u003e\u003c\/p\u003e\n \n\u003ch4\u003e1. INTRODUCTION\u003c\/h4\u003e\n\u003cp\u003eGlucagon-like peptide-1 (GLP‑1) receptor agonists represent a substantial advance in pharmacological obesity\n management. In the STEP 1 clinical trial, once-weekly subcutaneous semaglutide 2.4 mg produced mean total body weight\n loss of 14.9% over 68 weeks, compared to 2.4% in the placebo group receiving lifestyle intervention alone —\n approximately 6.2 times greater weight loss than lifestyle intervention alone.¹\u003c\/p\u003e\n\u003cp\u003eHowever, a consistent finding across GLP‑1 clinical trials is that a meaningful proportion of weight lost derives\n from lean tissue rather than adipose tissue. Neeland et al. documented lean mass reductions of 40–60% of total weight\n lost in some GLP‑1 trial cohorts, with substantial heterogeneity across studies.² Prado et al., in a commentary in The\n Lancet Diabetes \u0026 Endocrinology, reported lean mass loss of 25–39% of total weight lost across medically induced\n weight loss programs.³\u003c\/p\u003e\n\u003cp\u003eThis is clinically significant because skeletal muscle mass is a primary determinant of resting metabolic rate (RMR)\n — the baseline energy expenditure that determines whether a patient can sustain their new body weight after treatment\n ends.⁶ In the STEP 1 extension trial, participants who discontinued semaglutide without a structured metabolic exit\n protocol regained two-thirds of their prior weight loss within one year of stopping treatment.⁴\u003c\/p\u003e\n\u003cp\u003eThe Hume Health platform combines GLP‑1 therapy with high-frequency body composition measurement via bioelectrical\n impedance analysis (BIA), physician oversight informed by longitudinal tissue-level data, and an AI guidance system\n (Pro.f) that surfaces body composition patterns for clinical review and member adherence. This analysis examines\n whether this protocol-supported approach is associated with lean mass outcomes below published benchmarks.\n\u003c\/p\u003e\n \n\u003ch4\u003e2. METHODS\n\u003c\/h4\u003e\n\u003cp\u003e\u003cb\u003e2.1 Study Design\u003c\/b\u003e\u003c\/p\u003e\n\u003cp\u003eThis was a retrospective cohort analysis of real-world member data from the Hume Health platform. The analysis period\n spanned active program enrollment through March 2026. The study was conducted under Hume Health Corp internal data\n governance protocols. Member data were de-identified prior to analysis. The study did not constitute human subjects\n research requiring institutional review board oversight under 45 CFR 46 as it involved retrospective analysis of\n de-identified operational data.\u003c\/p\u003e\n\u003cp\u003e\u003cb\u003e2.2 Participants\n \u003c\/b\u003e\u003c\/p\u003e\n\u003cp\u003eEligible participants were Hume Health premium members who: (1) were actively enrolled in a GLP‑1 therapy program\n during the analysis period; (2) completed a minimum of three Hume Body body composition measurements per week\n throughout the measurement window; and (3) completed weekly attestations confirming engagement with and adherence to\n Pro.f AI protocol guidance. Members who did not meet all three criteria were excluded from analysis.\u003c\/p\u003e\n\u003cp\u003e\u003cb\u003e2.3 Measurements\u003c\/b\u003e\u003c\/p\u003e\n\u003cp\u003eBody weight and body composition were measured at each weigh-in using the Hume Pod, a bioelectrical impedance analysis\n device measuring whole-body and segmental lean mass, fat mass, and total body water. BIA measurements were recorded at\n consistent times relative to weigh-in. Lean mass at peak weight (highest recorded body weight during the measurement\n window) and lean mass at nadir weight (lowest recorded body weight) were identified for each member. Lean mass delta\n was computed as lean mass at nadir minus lean mass at peak. Weight loss was computed as peak weight minus nadir\n weight.\n\u003c\/p\u003e\n\u003cp\u003eLean mass loss as a percentage of total weight lost was computed for each member as: (|lean mass delta| \/ weight\n loss) × 100, where lean mass delta was negative for members who lost lean mass and positive for members who preserved\n or gained lean mass. The primary aggregate outcome — weighted mean lean mass loss as a percentage of total weight lost\n — was computed as: (sum of lean mass deltas across all members \/ sum of total weight lost across all members) × 100,\n reflecting the population-level ratio of lean mass change to total weight change.\n\u003c\/p\u003e\n\u003cp\u003e\u003cb\u003e2.4 Statistical Analysis\u003c\/b\u003e\u003c\/p\u003e\n\u003cp\u003eDescriptive statistics were computed for all primary and secondary outcomes. Continuous variables are reported as\n mean (standard deviation) and median. The weighted mean was used as the primary outcome measure for lean mass loss as\n a percentage of total weight lost, as it accounts for variation in total weight lost across members and reflects the\n aggregate population-level body composition response. Members who preserved or gained lean mass during the measurement\n period (lean mass delta ≥ 0) are included in all analyses; their inclusion in the weighted mean computation reduces\n the aggregate lean mass loss percentage relative to analyses restricted to members with lean mass loss.\u003c\/p\u003e\n\u003ch4\u003e3. RESULTS\u003c\/h4\u003e\n\u003cp\u003e\u003cb\u003e3.1 Participant Characteristics\u003c\/b\u003e\u003c\/p\u003e\n\u003cp\u003eA total of 6,990 members met all eligibility criteria and were included in the analysis. Baseline characteristics are\n presented in Table 1.\u003c\/p\u003e\n \n\u003cdiv class=\"table_drawer\"\u003e\n \u003cp\u003eTable 1. Baseline Participant Characteristics (n = 6,990)\u003c\/p\u003e\n \u003ctable border=\"1\"\u003e\n \u003ctr\u003e\n \u003cth\u003eCharacteristic\u003c\/th\u003e\n \u003cth\u003eValue\u003c\/th\u003e\n \u003c\/tr\u003e\n \u003ctr\u003e\n \u003ctd\u003eSample size (n)\u003c\/td\u003e\n \u003ctd\u003e6,990\u003c\/td\u003e\n \u003c\/tr\u003e\n \u003ctr\u003e\n \u003ctd\u003eMean baseline weight, kg (SD)\u003c\/td\u003e\n \u003ctd\u003e105.3 (21.8)\u003c\/td\u003e\n \u003c\/tr\u003e\n \u003ctr\u003e\n \u003ctd\u003eMedian baseline weight, kg\u003c\/td\u003e\n \u003ctd\u003e102.3\u003c\/td\u003e\n \u003c\/tr\u003e\n \u003ctr\u003e\n \u003ctd\u003eMeasurement frequency (minimum)\u003c\/td\u003e\n \u003ctd\u003e3 weigh-ins per week\u003c\/td\u003e\n \u003c\/tr\u003e\n \u003ctr\u003e\n \u003ctd\u003eProof engagement attestation\u003c\/td\u003e\n \u003ctd\u003eWeekly (required for inclusion)\u003c\/td\u003e\n \u003c\/tr\u003e\n \u003c\/table\u003e\n\u003c\/div\u003e\n \n\u003cp\u003e\u003cb\u003e3.2 Weight Loss Outcomes\n \u003c\/b\u003e\u003c\/p\u003e\n\u003cp\u003eMean total weight lost was 21.9 kg (SD 6.8), representing a mean reduction of 21.3% (SD 6.7%) of baseline body\n weight. Median weight lost was 19.6 kg, representing 20.0% of baseline body weight. Weight loss outcomes are presented\n in Table 2.\u003c\/p\u003e\n \n\u003cp\u003eTable 2. Weight Loss Outcomes\u003c\/p\u003e\n\u003cdiv class=\"table_drawer2\"\u003e\n \u003ctable border=\"1\"\u003e\n \u003ctr\u003e\n \u003cth\u003eOutcome\u003c\/th\u003e\n \u003cth\u003eResult\u003c\/th\u003e\n \u003c\/tr\u003e\n \u003ctr\u003e\n \u003ctd\u003eMean weight loss, kg (SD)\u003c\/td\u003e\n \u003ctd\u003e21.9 (6.8)\u003c\/td\u003e\n \u003c\/tr\u003e\n \u003ctr\u003e\n \u003ctd\u003eMedian weight loss, kg\u003c\/td\u003e\n \u003ctd\u003e19.6\u003c\/td\u003e\n \u003c\/tr\u003e\n \u003ctr\u003e\n \u003ctd\u003eMean weight loss, % of baseline (SD)\u003c\/td\u003e\n \u003ctd\u003e21.3% (6.7%)\u003c\/td\u003e\n \u003c\/tr\u003e\n \u003ctr\u003e\n \u003ctd\u003eMedian weight loss, % of baseline\u003c\/td\u003e\n \u003ctd\u003e20.0%\u003c\/td\u003e\n \u003c\/tr\u003e\n \u003ctr\u003e\n \u003ctd\u003eMinimum weight loss, kg\u003c\/td\u003e\n \u003ctd\u003e15.7\u003c\/td\u003e\n \u003c\/tr\u003e\n \u003ctr\u003e\n \u003ctd\u003eMaximum weight loss, kg\u003c\/td\u003e\n \u003ctd\u003e75.4\u003c\/td\u003e\n \u003c\/tr\u003e\n \u003c\/table\u003e\n\u003c\/div\u003e\n\u003cp\u003e\u003cb\u003e3.3 Lean Mass Outcomes\u003c\/b\u003e\u003c\/p\u003e\n\u003cp\u003eThe weighted mean lean mass loss as a percentage of total weight lost was 16.9% across all 6,990 members. The median\n lean mass loss as a percentage of total weight lost was 19.4%. A total of 890 members (12.7%) preserved or increased\n lean mass over the measurement period (lean mass delta ≥ 0). Among the 6,100 members (87.3%) who lost lean mass, the\n mean lean mass loss as a percentage of total weight lost was 22.0%. Lean mass outcomes are presented in Table 3.\u003c\/p\u003e\n \n\u003cp\u003eTable 3. Lean Mass Outcomes\u003c\/p\u003e\n\u003cdiv class=\"table_drawer3\"\u003e\n \u003ctable border=\"1\"\u003e\n \u003ctr\u003e\n \u003cth\u003eOutcome\u003c\/th\u003e\n \u003cth\u003eResult\u003c\/th\u003e\n \u003c\/tr\u003e\n \u003ctr\u003e\n \u003ctd\u003eWeighted mean lean mass loss, % of total weight lost (all members)\u003c\/td\u003e\n \u003ctd\u003e16.9%\u003c\/td\u003e\n \u003c\/tr\u003e\n \u003ctr\u003e\n \u003ctd\u003eMedian lean mass loss, % of total weight lost (all members)\u003c\/td\u003e\n \u003ctd\u003e19.4%\u003c\/td\u003e\n \u003c\/tr\u003e\n \u003ctr\u003e\n \u003ctd\u003eMembers preserving or gaining lean mass, n (%)\u003c\/td\u003e\n \u003ctd\u003e890 (12.7%)\u003c\/td\u003e\n \u003c\/tr\u003e\n \u003ctr\u003e\n \u003ctd\u003eMembers losing lean mass, n (%)\u003c\/td\u003e\n \u003ctd\u003e6,100 (87.3%)\u003c\/td\u003e\n \u003c\/tr\u003e\n \u003ctr\u003e\n \u003ctd\u003eMean lean mass loss, % of total weight lost (among those with lean mass loss)\u003c\/td\u003e\n \u003ctd\u003e22.0%\u003c\/td\u003e\n \u003c\/tr\u003e\n \u003ctr\u003e\n \u003ctd\u003ePublished benchmark (Prado et al., 2024; Neeland et al., 2024)\u003c\/td\u003e\n \u003ctd\u003e25–39% (range across GLP-1 trials)\u003c\/td\u003e\n \u003c\/tr\u003e\n \u003c\/table\u003e\n\u003c\/div\u003e\n \n\u003cp\u003e\u003cb\u003e3.4 Interpretation of the Weighted Mean Outcome\u003c\/b\u003e\u003c\/p\u003e\n\u003cp\u003eThe weighted mean of 16.9% reflects the aggregate population-level ratio of total lean mass change to total weight\n lost across all members. Because members who preserved or gained lean mass (12.7% of the cohort) contribute negative\n lean mass loss values to the numerator, the weighted mean is lower than the mean computed among members who lost lean\n mass exclusively (22.0%). Both measures are reported to provide transparency regarding cohort composition. The\n weighted mean is the primary outcome because it most accurately represents the population-level body composition\n impact of the program.\u003c\/p\u003e\n\u003ch4\u003e4. DISCUSSION\n\u003c\/h4\u003e\n\u003cp\u003eThis analysis demonstrates that Hume Health premium members on GLP‑1 therapy, who met defined body composition\n monitoring and AI protocol engagement criteria, experienced lean mass loss substantially below the benchmarks\n documented in published GLP‑1 clinical trials. The weighted mean lean mass loss of 16.9% of total weight lost compares\n favorably to the 25–39% range reported by Prado et al.³ and the 40–60% upper range reported in some cohorts by Neeland\n et al.²\n\u003c\/p\u003e\n\u003cp\u003eThe mechanism by which frequent body composition measurement and protocol-guided engagement may attenuate lean mass\n loss is consistent with established physiology. Skeletal muscle mass is the primary determinant of resting metabolic\n rate.⁶ Interventions that preserve lean mass during caloric restriction — including higher protein intake, resistance\n exercise, and dose calibration timed to body composition response — are documented to reduce lean mass loss during\n weight reduction. The Hume platform protocol facilitates tissue-level visibility that enables these calibrations in\n near real-time; the present analysis cannot isolate which components of the program contributed to the observed\n outcomes.\n\u003c\/p\u003e\n\u003cp\u003eThe finding that 12.7% of members preserved or gained lean mass during GLP‑1-assisted weight loss is notable. This\n subgroup is likely influenced by favorable baseline characteristics, behavioral factors, and variability in BIA\n measurement across conditions, and should not be interpreted as a program-level guarantee of lean mass preservation.\n Its inclusion in the weighted mean reduces the reported aggregate lean mass loss figure relative to analyses\n restricted to members who lost lean mass.\u003c\/p\u003e\n\u003cp\u003e\u003cb\u003e4.1 Limitations\n \u003c\/b\u003e\u003c\/p\u003e\n\u003cp\u003eThis analysis has several limitations that should be considered when interpreting results. First, the study is\n retrospective and observational, without a concurrent control group. Comparison to published clinical trial benchmarks\n involves differences in population, measurement methodology, and GLP‑1 agent. Second, body composition was measured\n via bioelectrical impedance analysis rather than dual-energy X-ray absorptiometry (DXA) or magnetic resonance imaging\n (MRI), which are considered the reference standards for lean mass quantification. BIA measurements are sensitive to\n hydration status, time of measurement, and device calibration, and may produce systematic differences relative to\n DXA-derived lean mass values. Third, the cohort consists of premium-tier members who met a minimum engagement\n threshold; results may not generalize to members with lower engagement frequency or to non-engaged GLP‑1 users.\n Fourth, no information on dietary protein intake, resistance exercise participation, or specific GLP‑1 agent and\n dosing schedule was incorporated into this analysis, and these variables are likely to influence lean mass outcomes.\n Fifth, the duration of the measurement window varied across members and was determined by the interval between peak\n and nadir weight rather than a fixed protocol period.\u003c\/p\u003e\n\u003cp\u003e\u003cb\u003e4.2 Future Directions\u003c\/b\u003e\u003c\/p\u003e\n\u003cp\u003eProspective controlled study designs with standardized measurement protocols, dietary and exercise co-variate\n capture, and DXA-validated BIA calibration would provide stronger evidence for the role of high-frequency monitoring\n and AI-guided adherence in lean mass preservation during GLP‑1 therapy. Subgroup analyses examining the impact of\n engagement frequency, protein intake, resistance training participation, and GLP‑1 agent on lean mass outcomes would\n further characterize the mechanisms underlying these findings.\u003c\/p\u003e\n\u003cp\u003e\u003cb\u003e5. CONCLUSIONS\u003c\/b\u003e\u003c\/p\u003e\n\u003cp\u003eAmong 6,990 Hume Health premium members on GLP‑1 therapy who met defined body composition monitoring and AI protocol\n engagement criteria, the weighted mean lean mass loss as a percentage of total weight lost was 16.9%. This is\n substantially below the 25–39% range reported in published GLP‑1 clinical trial literature. The median lean mass loss\n was 19.4%. These findings are consistent with the hypothesis that high-frequency tissue-level monitoring, combined\n with AI-guided protocol adherence and physician oversight informed by body composition data, supports favorable lean\n mass outcomes during medically assisted weight loss. Prospective controlled research is needed to confirm these\n findings and to isolate the active components of the platform protocol.\n\u003c\/p\u003e\n \n\u003ch4\u003eREFERENCES\u003c\/h4\u003e\n \n\u003cp\u003e1. Wilding JPH, Batterham RL, Calanna S, et al. Once-Weekly Semaglutide in Adults with Overweight or Obesity. N Engl\n J Med. 2021;384(11):989–1002. doi:10.1056\/NEJMoa2032183.\u003c\/p\u003e\n\u003cp\u003e2. Neeland IJ, Linge J, Birkenfeld AL. Changes in lean body mass with glucagon-like peptide-1-based therapies and\n mitigation strategies. Diabetes Obes Metab. 2024;26(Suppl 4):16–27. doi:10.1111\/dom.15728.\u003c\/p\u003e\n\u003cp\u003e3. Prado CM, Phillips SM, Gonzalez MC, Heymsfield SB. Muscle matters: the effects of medically induced weight loss on\n skeletal muscle. Lancet Diabetes Endocrinol. 2024;12(11):785–787. doi:10.1016\/S2213-8587(24)00272-9.\u003c\/p\u003e\n\u003cp\u003e4. Wilding JPH, Batterham RL, Davies M, et al. Weight regain and cardiometabolic effects after withdrawal of\n semaglutide: The STEP 1 trial extension. Diabetes Obes Metab. 2022;24(8):1553–1564. doi:10.1111\/dom.14725.\u003c\/p\u003e\n\u003cp\u003e5. Hume Health Corp. Lean Mass Preservation in GLP‑1 Members: An Internal Outcomes Analysis. 2024. Analysis of 6,990\n premium members. Methodology available on request: research@humehealth.com.\n\u003c\/p\u003e\n\u003cp\u003e6. Ravussin E, Bogardus C. Skeletal muscle metabolism is a major determinant of resting energy expenditure. J Appl\n Physiol. 1989;66(3). PMID:2243122.\n\u003c\/p\u003e\n \n\u003cp\u003e\u003cb\u003eDisclosure Statement\n \u003c\/b\u003e\u003c\/p\u003e\n\u003cp\u003eThis analysis was conducted by Hume Health Corp using data from the Hume Health platform. Hume Health Corp is the\n developer of the body composition monitoring hardware (Hume Body Pod) and AI guidance system (Pro.f) evaluated in this\n analysis. No external funding was received. The analysis has not undergone independent peer review. Investigators have\n an inherent commercial interest in the outcomes described.\u003c\/p\u003e"
},
"width": 750,
"transitionDuration": 150
}
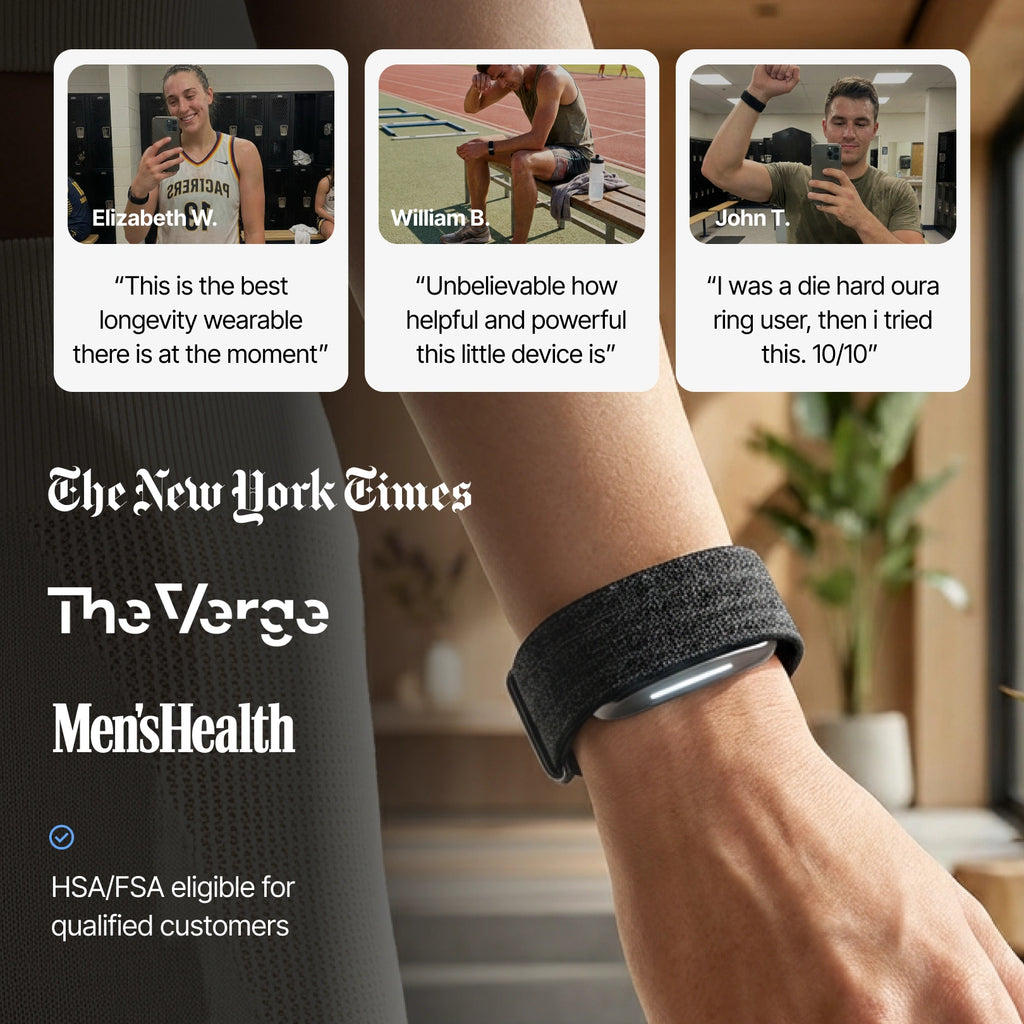
As seen in







Your Smartwatch Won't Leave You Alone. 6 Reasons the Screenless Hume Band Will
All the health data. None of the noise. No screen, no notifications, nothing glowing on your wrist at 2am.
Somewhere along the way, health tracking turned into a second job: a screen to check, alerts to clear, a charger to remember every single night. The Hume Band reads your recovery, sleep, HRV and blood-pressure trend insights around the clock and never once asks for your attention. Here are the six reasons the quietest wearable is the one people actually keep wearing.
- No screen, no notifications, ever
- Comfortable enough to sleep in
- Charge it twice a month, not nightly
- 0
- Pings, buzzes or glowing screens
- 14 days
- Battery per charge
- 4.7★
- 2,955 verified reviews
 1/10
1/10The quietest wearable you will ever own

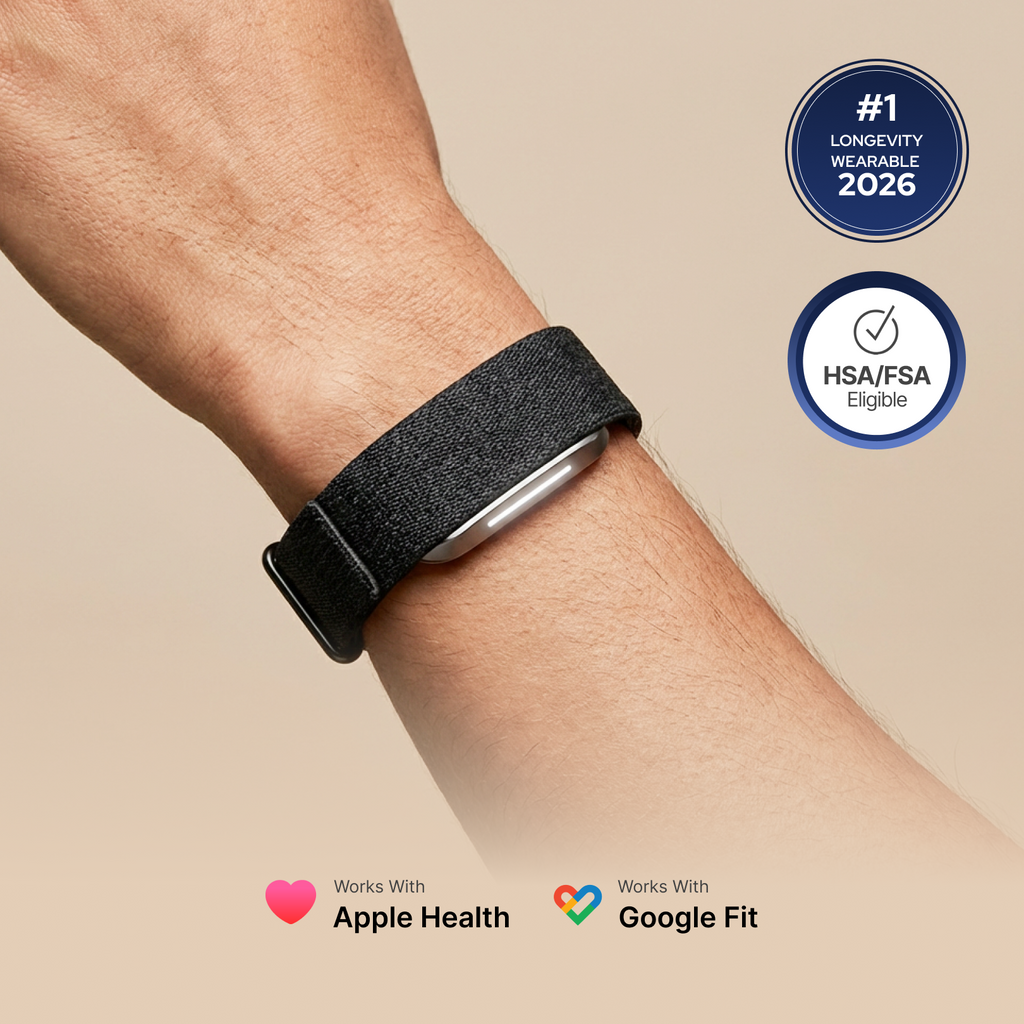
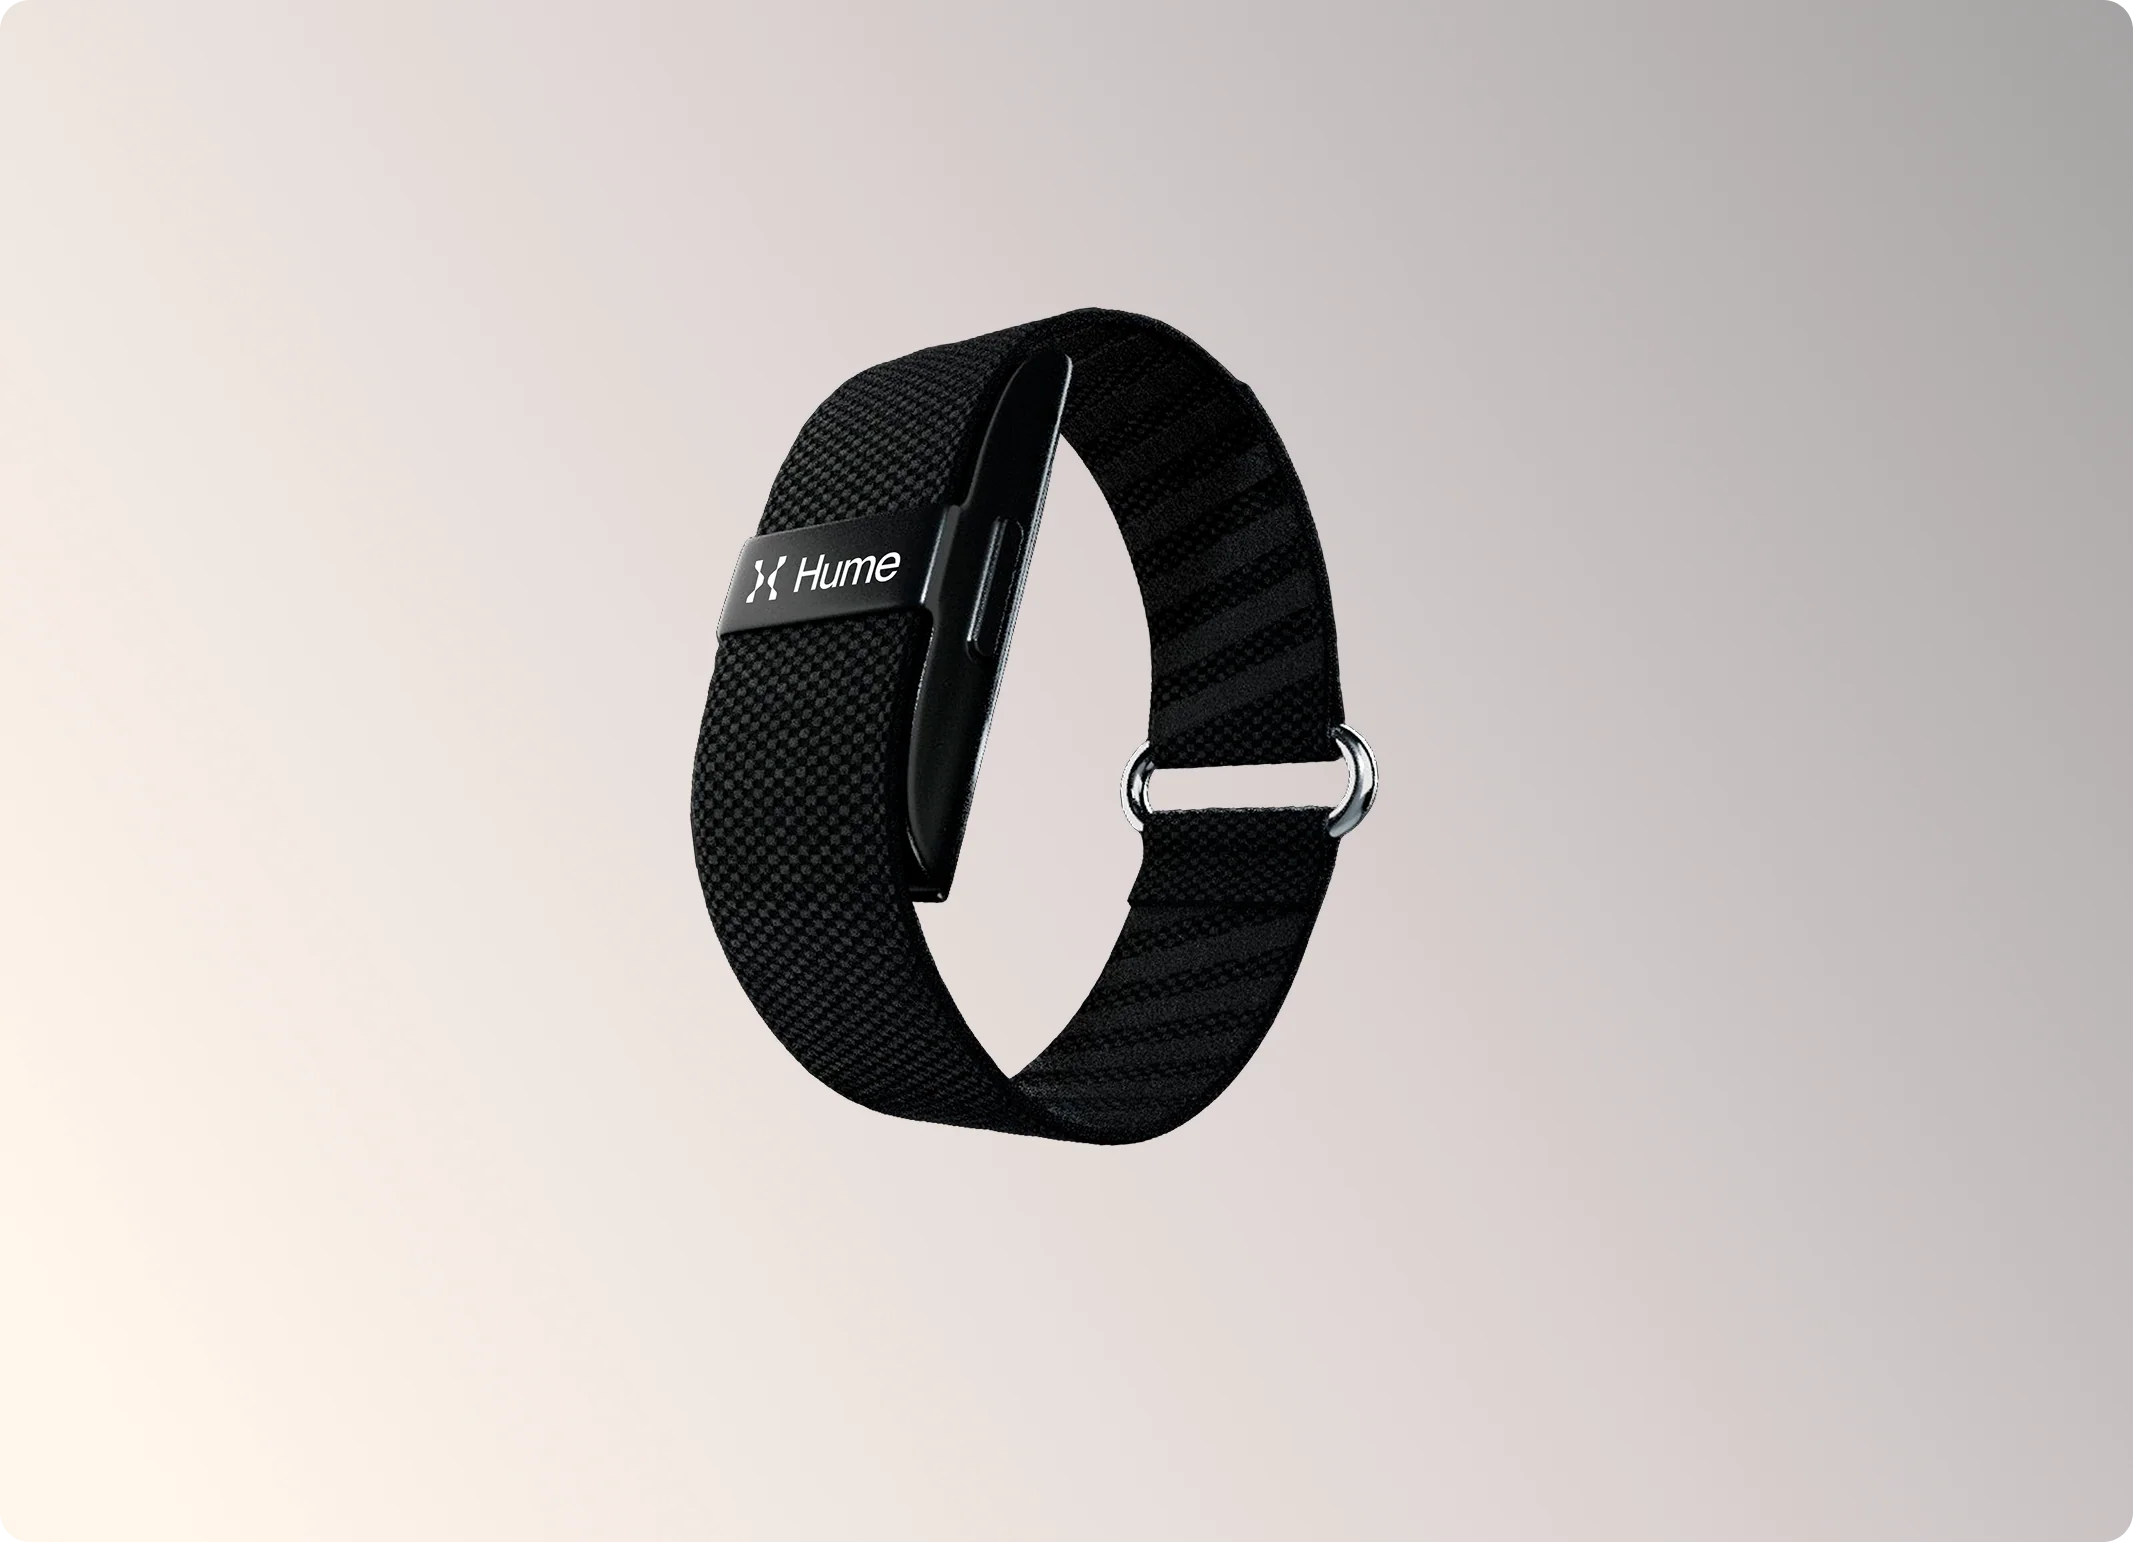
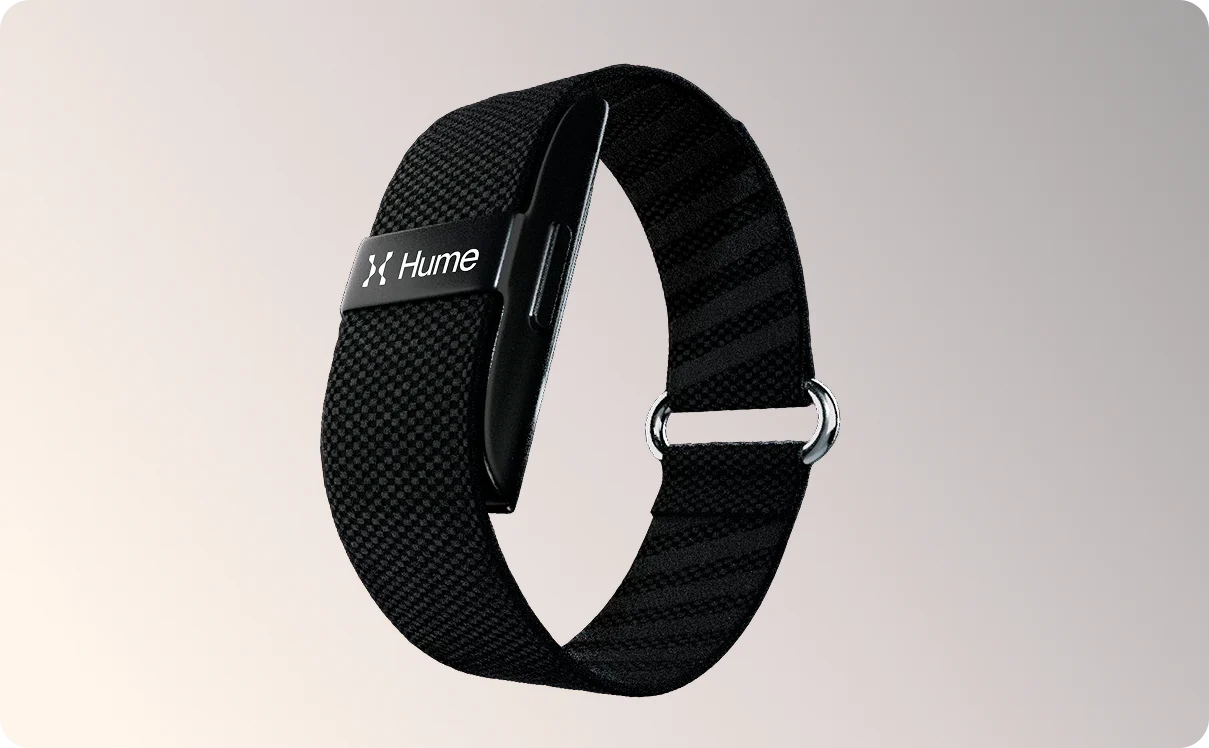
Every wearable makes the same promise: know your body better. Almost all of them attach a demand to it: look at me. The Hume Band drops the demand. There is no screen to light up, no ping to swat away, no buzz cutting into a meeting or a dinner. It sits low on your wrist and quietly reads.
The quiet does not mean it is doing less. Around the clock it tracks HRV, resting heart rate, sleep stages, recovery and blood-pressure trend insights, all wellness signals, never a diagnosis. Hume's AI turns thousands of daily readings into the handful of scores that matter. It all happens in silence, and waits in the app until you ask.
Nothing buzzes. Nothing glows. Nothing interrupts.
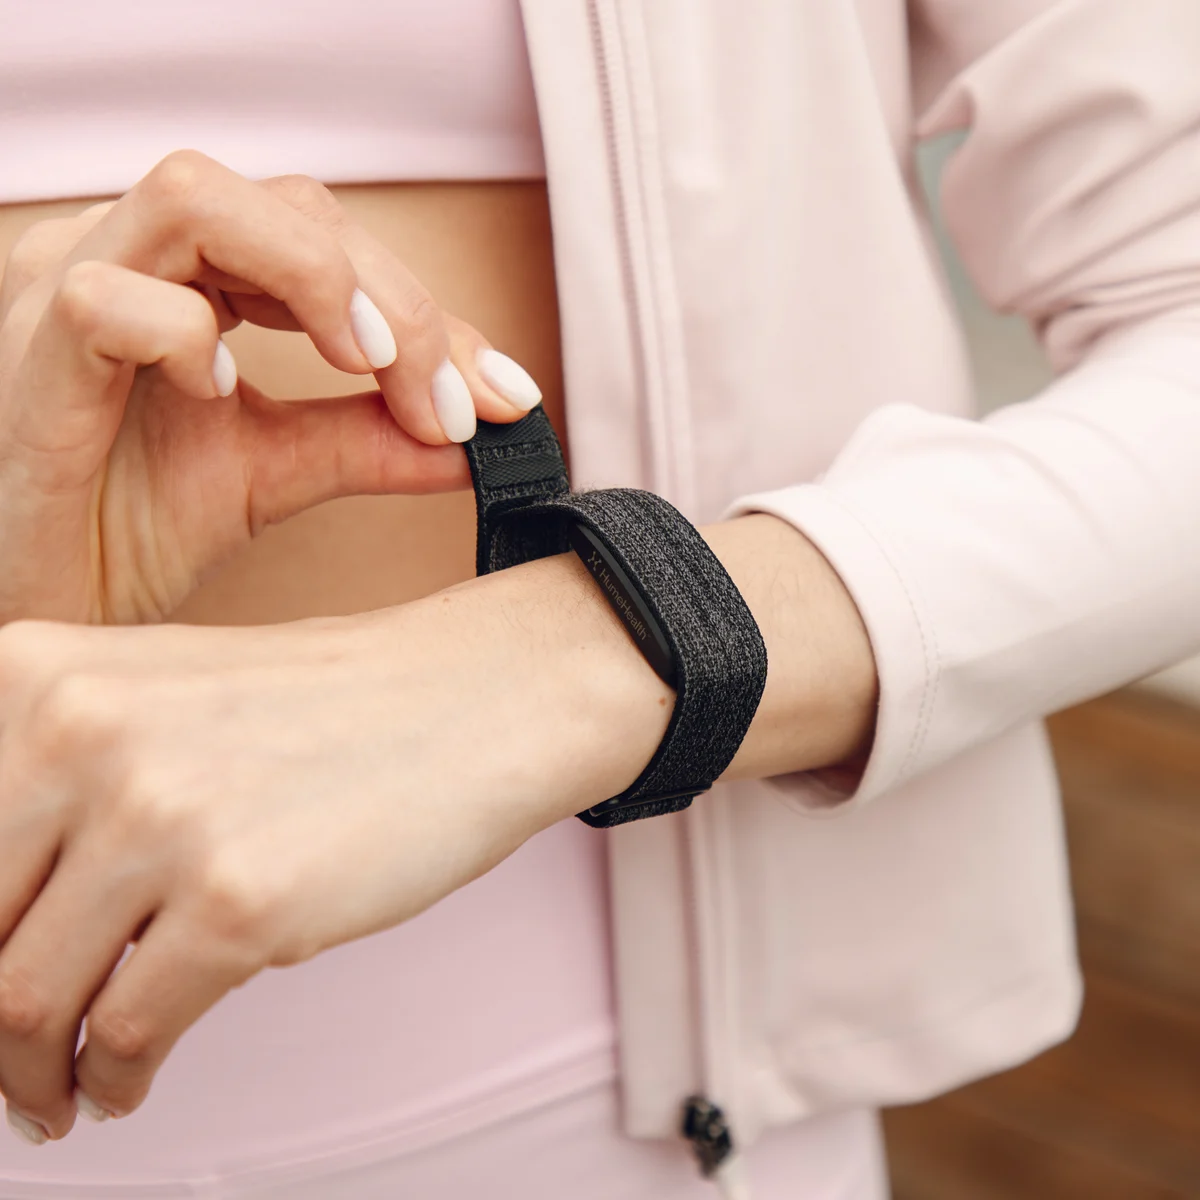
A smartwatch is a second phone strapped to your wrist. Texts, emails, likes and calendar alerts follow you into workouts, conversations and family dinners, and every glance drags you out of whatever you were doing. You bought it for the health data. What it mostly delivers is one more channel demanding a reaction.
The Band takes the opposite bet: tracking your health should cost you nothing in attention. No screen to check, no feed to refresh, no red dot to clear. At night, nothing glows on your wrist or your nightstand. The tracking loses nothing. You lose the noise.

Comfortable enough that your sleep data is actually complete

 Recommended by
Dr. Seth Capehart
Emergency Medicine, MD
Recommended by
Dr. Seth Capehart
Emergency Medicine, MD
The signals that matter most get recorded while you sleep: how HRV rebounds overnight, where resting heart rate settles, how much deep and REM you actually got. A tracker only captures that if you truly wear it to bed, and nobody sleeps in something rigid, glowing or pressing a hard screen into their wrist.
The Band was built for the night shift. The soft woven UltraLux strap is light enough that most owners forget it is on, and with no screen there is nothing to light up when you roll over. You sleep like it is not there. Every morning, the whole night is waiting: stages, recovery, trends.
Recommended by
Dr. Seth Capehart
Emergency Medicine, MD
You check your data. It never demands you do.
Pace of Aging
32yrs
Biological Age
YoungerOlder
Chronological Age 45 yrs
Directional estimate, moves with your habits.
 Trusted by
Dr. Yaz Dominguez
Board-certified Family Medicine, DO@doctor_yaz
Trusted by
Dr. Yaz Dominguez
Board-certified Family Medicine, DO@doctor_yaz
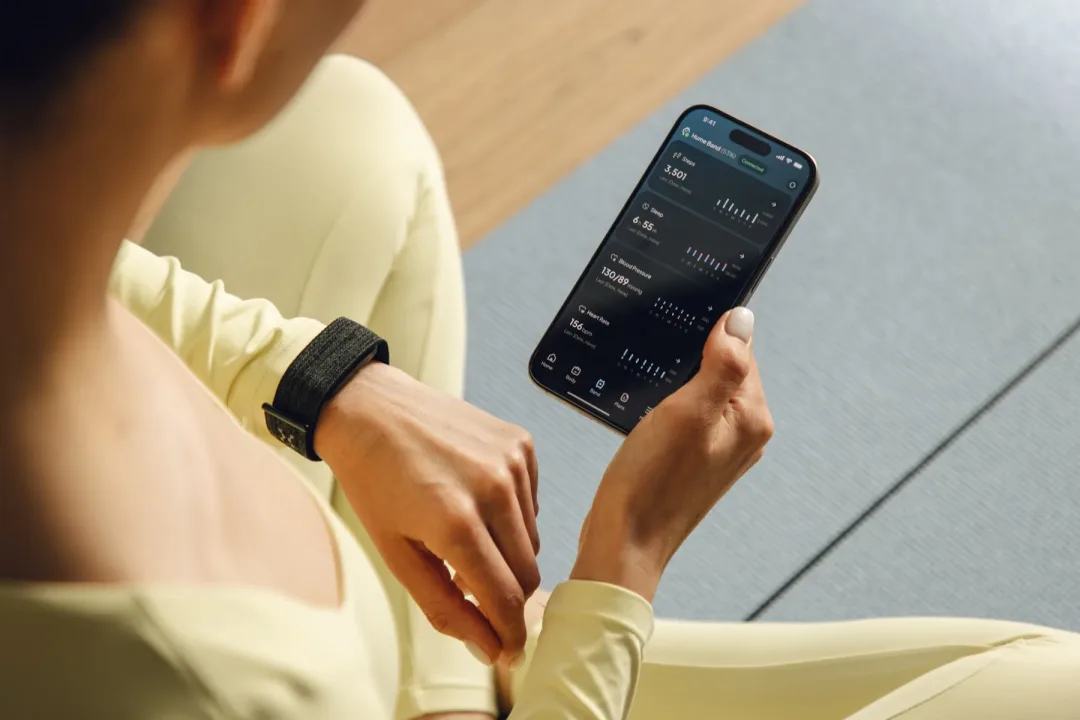
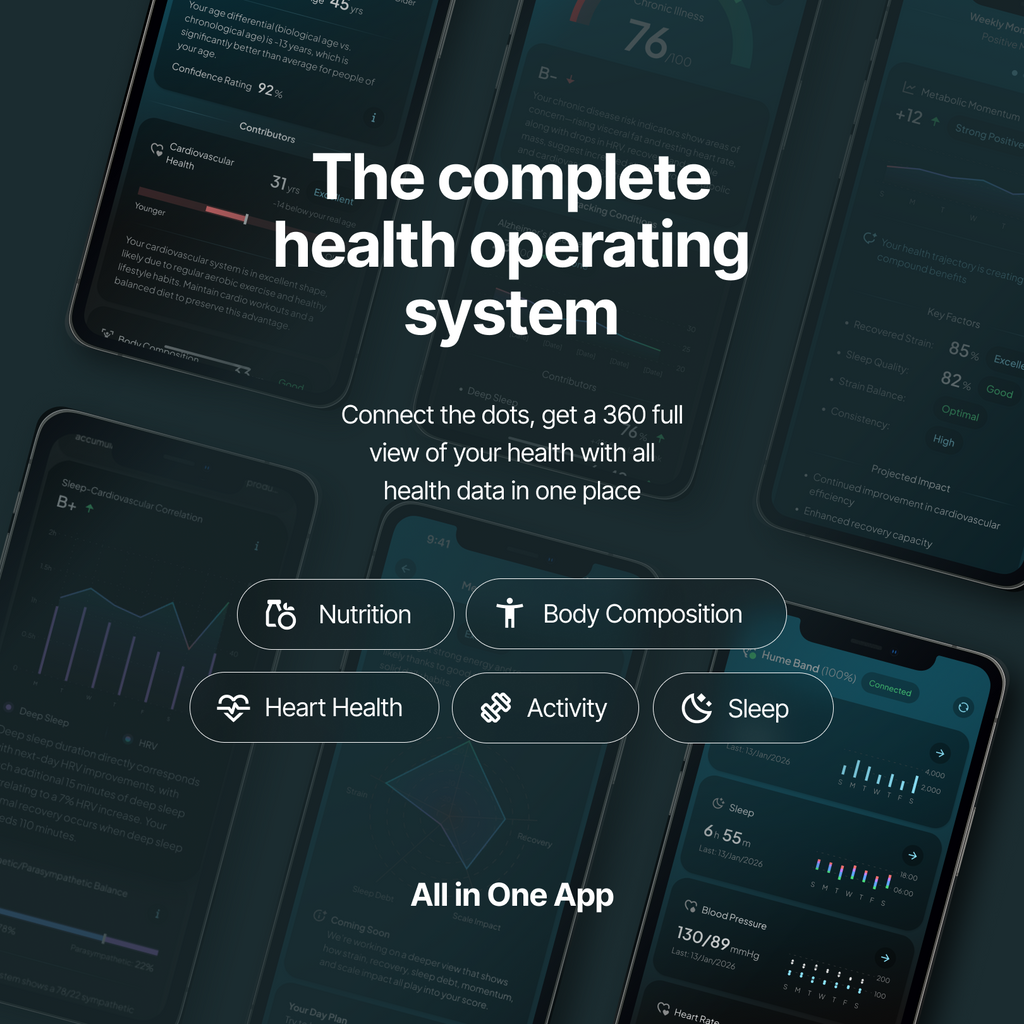
Here is where all that quiet pays off: the free Hume app. Recovery, sleep, Metabolic Momentum and your blood-pressure trend insights are organized into a glance that takes half a minute over coffee. The Band never pushes any of it to you. The data waits, and you decide when looking is worth your time.
Owners settle into their own rhythm. Daniel K., a verified owner, says Metabolic Momentum "became something I check each morning." Others open the app on Sundays to read the week's trends, or bring a pattern to their annual physical. That is the healthy version of the habit: you reaching for insight, not a wrist buzzing until you react.
Pace of Aging
32yrs
Biological Age
YoungerOlder
Chronological Age 45 yrs
Directional estimate, moves with your habits.
Trusted by
Dr. Yaz Dominguez
Board-certified Family Medicine, DO@doctor_yaz
What the quiet sounds like
Marcus L.
Verified
"Screenless is the whole point for me. All-day data, zero buzzing, comfortable enough that I forget it's on at night."
Sophie M.
Verified
"The 14-day battery is the quiet win. I charge it Sunday in the shower and never think about it again."
Daniel K.
Verified
"Metabolic Momentum became something I check each morning. HRV drops predictably after poor sleep or a glass of wine, and it lines up with how I feel."
Calm has a side effect: two weeks of battery
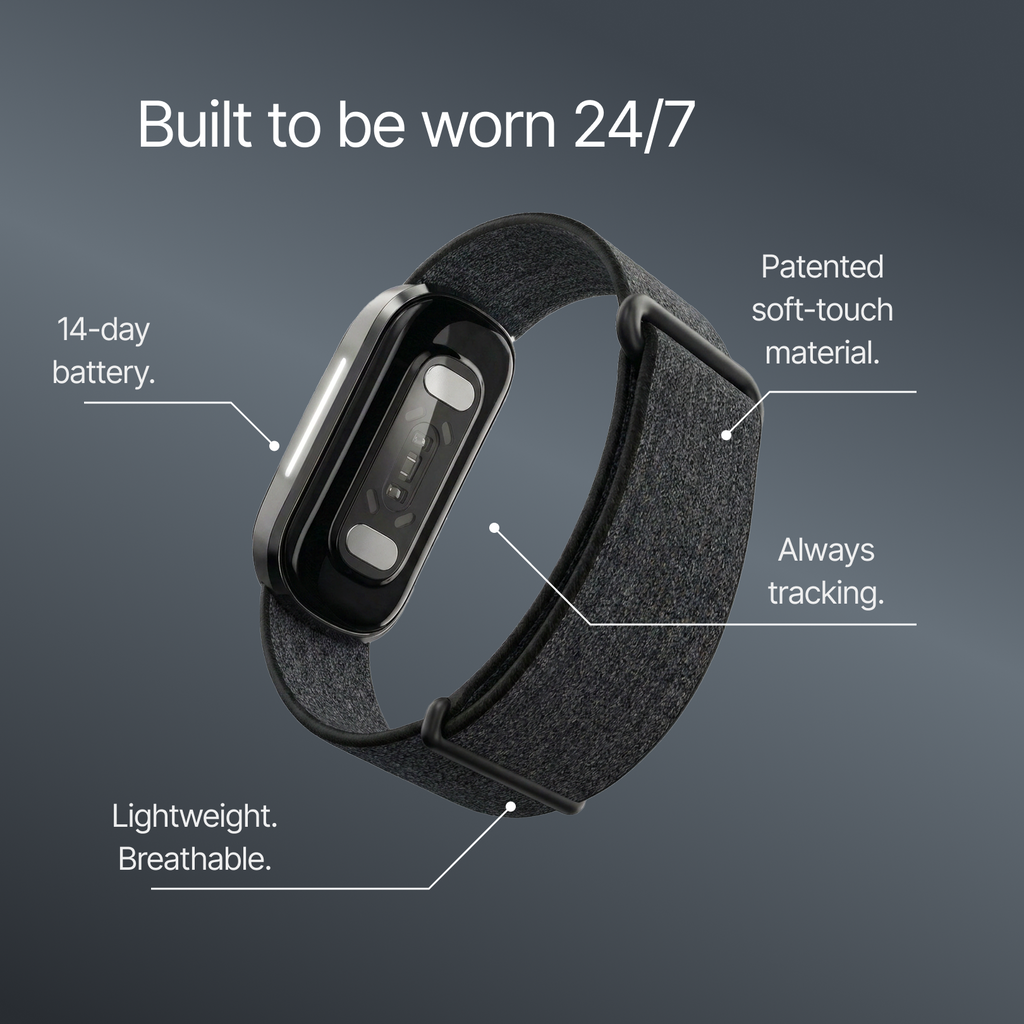
The screen is the hungriest part of every smartwatch, and the Band does not have one. That single choice rewrites the math: up to 14 days on a charge, and a full charge takes about 30 minutes. Most owners top it up during a shower every week or two, then forget charging exists.
That matters more than it sounds. A nightly charger is how wearables die: one forgotten evening becomes a gap in your sleep data, and the gap becomes a drawer. The wearable you keep wearing is the one that keeps measuring, and two weeks of battery is what keeps your trends unbroken from January to June.
Up to 14 days per charge. Full charge in about 30 minutes.
45 days at home to feel the difference, at 30% off
Limited time offer
--:--:--
Own it once. No subscription.
Own it once
2.243 kr
3.205 kr−30%
45-day at-home trial · free shipping · no subscription
Quiet is the one feature you cannot judge from a product page. You have to live with it: workdays, workouts, six weeks of nights with nothing glowing on your wrist. So Hume gives you 45 days at home, with launch pricing at $249, down 30% from $356, and free shipping.
If it is not the wearable that finally stays on your wrist, send it back for a full refund. No subscription starts billing while you decide, and your core scores stay free forever. 2,955 owners rate it 4.7 stars, and the trial means you can find out the quiet way: by wearing it.
Limited time offer
--:--:--
Own it once. No subscription.
Own it once
2.243 kr
3.205 kr−30%
45-day at-home trial · free shipping · no subscription
Get the Hume Band 2.0
The quietest wearable you'll ever own
No screen, no pings, every trend waiting in the free app. One-time $249, was $356, with a 45-day at-home trial and free shipping.

{
"type": "modal",
"contentType": "video",
"content": {
"title": "",
"video": "https://cdn.shopify.com/videos/c/o/v/85f4f6c396ad42bca85df3c9968fe377.mp4",
"autoplay": true
},
"width": 1024,
"transitionDuration": 700
}
{
"type": "slideout",
"contentType": "images",
"content": {
"title": "",
"images": ["//humehealth.com/cdn/shop/files/accuracy_report_1_c4993b5a-cf53-4671-9fda-8214f6a61306.webp?v=1763137898&width=1785","//humehealth.com/cdn/shop/files/accuracy_report_2_0a60d4d8-95ee-4abc-a50d-9d0472a18b18.webp?v=1763137911&width=1785","//humehealth.com/cdn/shop/files/accuracy_report_3_476bfdf8-3500-41cc-95e8-4a1a15f0012e.webp?v=1763137922&width=1785"]
},
"width": 750,
"transitionDuration": 700
}
{
"type": "slideout",
"contentType": "images",
"content": {
"title": "",
"images": ["//humehealth.com/cdn/shop/files/Modal_Always_Eligible.svg?v=1765544261&width=2000"]
},
"width": 750,
"transitionDuration": 700
}
{
"type": "slideout",
"contentType": "with_image",
"content": {
"title": "","image": "//humehealth.com/cdn/shop/files/hume_pod.webp?v=1764101038&width=932",
"imageWidth": "200","imageContent": "\u003ch2\u003eAbout Hume Pod\u003c\/h2\u003e\u003cp\u003eHume Pod tracks your complete body composition with clinical-grade precision - measuring muscle mass, body fat, visceral fat, bone density, metabolic age, and 45 other metrics - then shows you exactly how your habits are changing your body over time.\u003c\/p\u003e",
"secondaryContent": "\u003ch4\u003eThe only body analyzer for real progress tracking\u003c\/h4\u003e\u003cp\u003eHume Pod measures what actually determines your health and longevity, such as muscle gain, fat loss, visceral fat levels, and metabolic age.\u003c\/p\u003e\u003cp\u003eOur 8-Frequency BIA system reveals information like whether you're losing fat or just water weight, if you're building muscle even when the scale doesn't budge, dangerous visceral fat around your organs, and much more.\u003c\/p\u003e\u003ch4\u003eHow does it work?\u003c\/h4\u003e\u003cp\u003eHume Pod uses 8 electrodes and multi-frequency sensors to scan your entire body more accurately than standard scales - delivering 98% DEXA-level accuracy validated in lab studies and third-party testing. The metrics these sensors measure are:\u003c\/p\u003e\u003col\u003e\u003cli\u003eBody Fat Percentage\u003c\/li\u003e\u003cli\u003eSkeletal Muscle Mass\u003c\/li\u003e\u003cli\u003eVisceral Fat Level\u003c\/li\u003e\u003cli\u003eBone Density\u003c\/li\u003e\u003cli\u003eMetabolic Age\u003c\/li\u003e\u003cli\u003eBody Water Percentage\u003c\/li\u003e\u003cli\u003eProtein Mass\u003c\/li\u003e\u003cli\u003eBMI \u0026 Body Mass Index\u003c\/li\u003e\u003cli\u003eSegmental Analysis (arms, legs, torso measured separately)\u003c\/li\u003e\u003c\/ol\u003e\u003cp\u003eAdvanced algorithms analyze these measurements to detect patterns you can't see: muscle building in specific body parts, fat loss masked by water retention, declining metabolic health, visceral fat accumulation, and more.\u003c\/p\u003e"
},
"width": 750,
"transitionDuration": 700
}







FLASH SALE
(2,955)
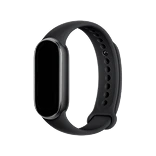
The Hume Band 2.0
Your body's early warning system
3.205 kr
2.243 kror

18 payments of kr124.63
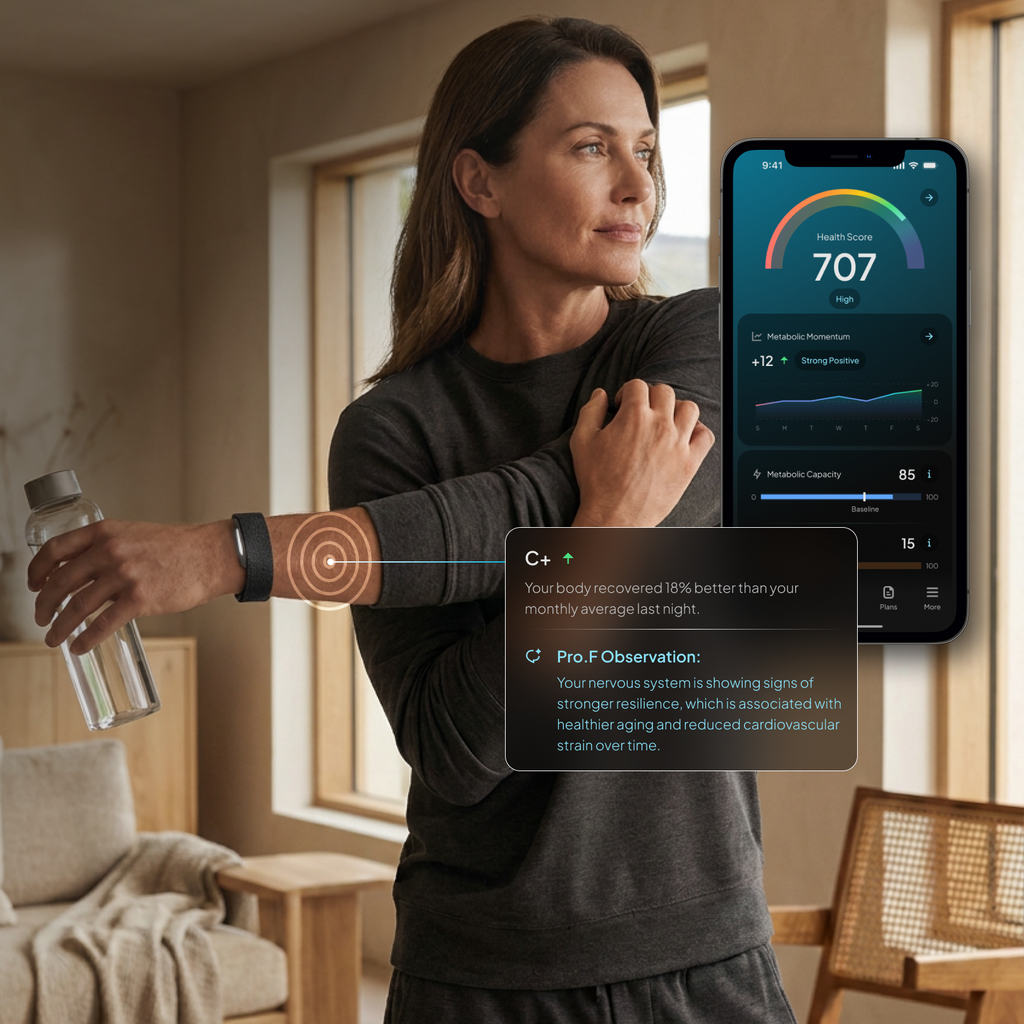
Hume Band reveals the health trends you can’t feel yet, showing how each habit impacts your future. Our app gives you clear steps to extend your energy, resilience, and lifespan.

45-day refund policy

Free worldwide shipping

Free app included

Ships by {delivery-date}
Choose your optional add-ons:
Each Hume Band comes with a 1-year warranty, but if you want to extend this you can tick below.

Not satisfied within 45 days? Get a full refund
That’s how confident we are in your results. But if you’re not thrilled, send it back and we’ll refund your purchase.
What it unlocks
- Your body's full story. Finally, in plain language.
- Find out how fast you're aging — then change it.
- Detect patterns your doctor hasn't caught yet.
- The deepest sleep insights on the market. Not just hours — what those hours did to your body.
- The why behind how you feel, every single day.
- See what's working. Cut what isn't.
- Every signal, unified. One intelligent view of your whole body.
"If you’re serious about staying healthy for the long run, this is the one tool I keep coming back to."
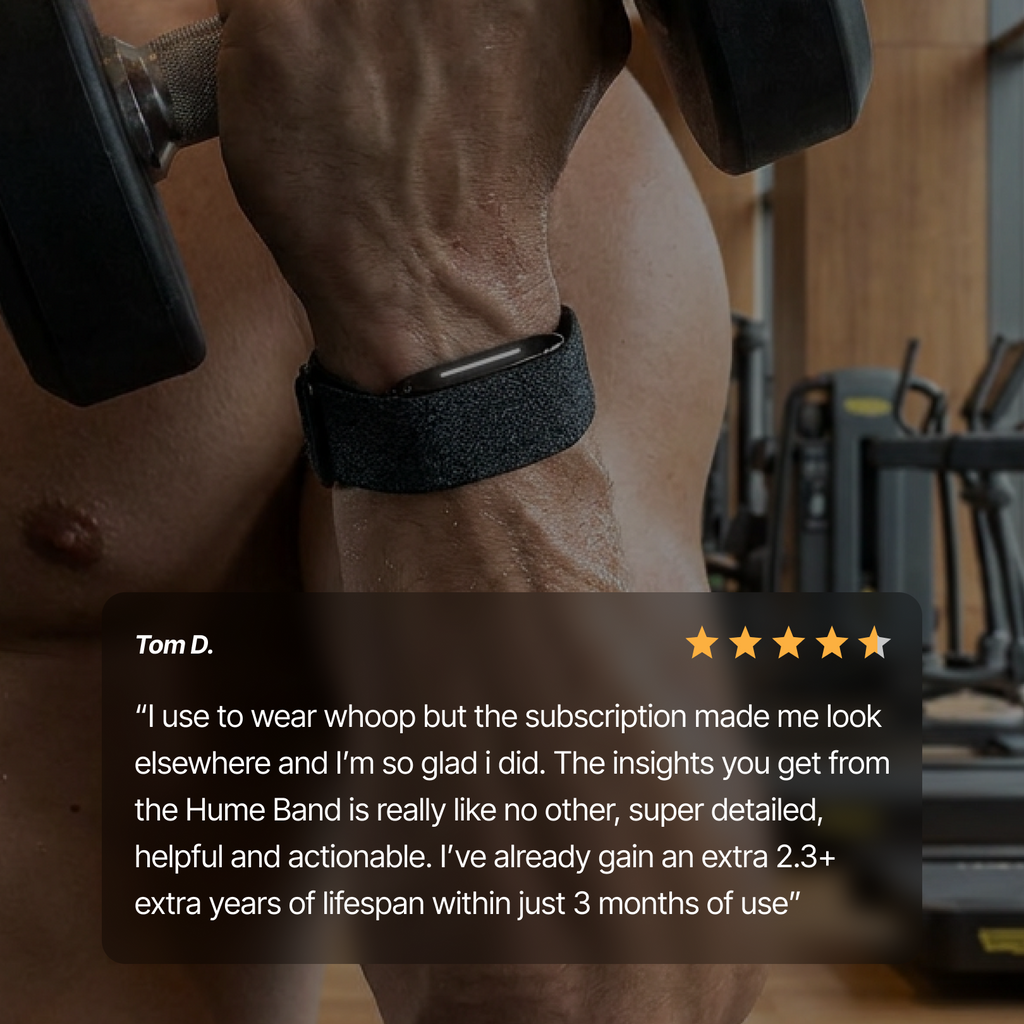
“I’ve trained my whole life, but the Hume Band taught me more about my body in 30 days than some trainers did in years. It’s accurate, it’s simple, and it shows you what’s actually improving...not just your steps."

Band 2.0 uses 5 LEDs and 4 photodiodes to capture your health data more frequently than most wearables - delivering best-in-class accuracy validated in lab studies and third-party testing. The biomarkers these sensors monitor are:
Blood Pressure Insights (NEW)
Heart Rate Variability (HRV)
Metabolic Momentum
Biological Age
Pace of Aging
Blood Oxygen Levels (SpO2)
Skin Temperature
Metabolic Capacity
Sleep Stages (Light, Deep, REM, Awake)
Activity Levels & Movement Patterns
Strain
Recovery Status
Our AI then translates this raw data into easy-to-understand insights, like whether or not your habits are speeding up or slowing down aging, if there are any early signs of illness, so you can make smarter health choices that expand your lifespan.

Just wear it
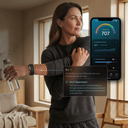
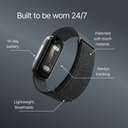
Band 2.0 sits comfortably on your wrist 24/7, automatically tracking heart rate variability, sleep stages, recovery depth, blood oxygen, skin temperature, activity levels, and strain.

Open the app each morning
Check the app to see what's happening inside your body and understand how your choices are affecting your health in real-time.

Take control with personalized action plans
Get clear, actionable steps to improve your recovery, sleep quality, energy levels, and long-term health with the Pro App membership.

Track your progress
See trends over weeks and months. Know definitively that your habits are working. Get proof you're building health, not running in circles.
Looking for more information?
🏆 The Award-Winning Longevity Band
Most people wait for a doctor to tell them something's wrong. You don't have to.
- See which habits move the needle (and which ones don't)
- Catch heart stress and recovery issues early
- Stay ahead of health problems instead of reacting to them


The Hume Band isn’t another tracker
Hume shows you what’s happening inside your body — not just how hard you worked.
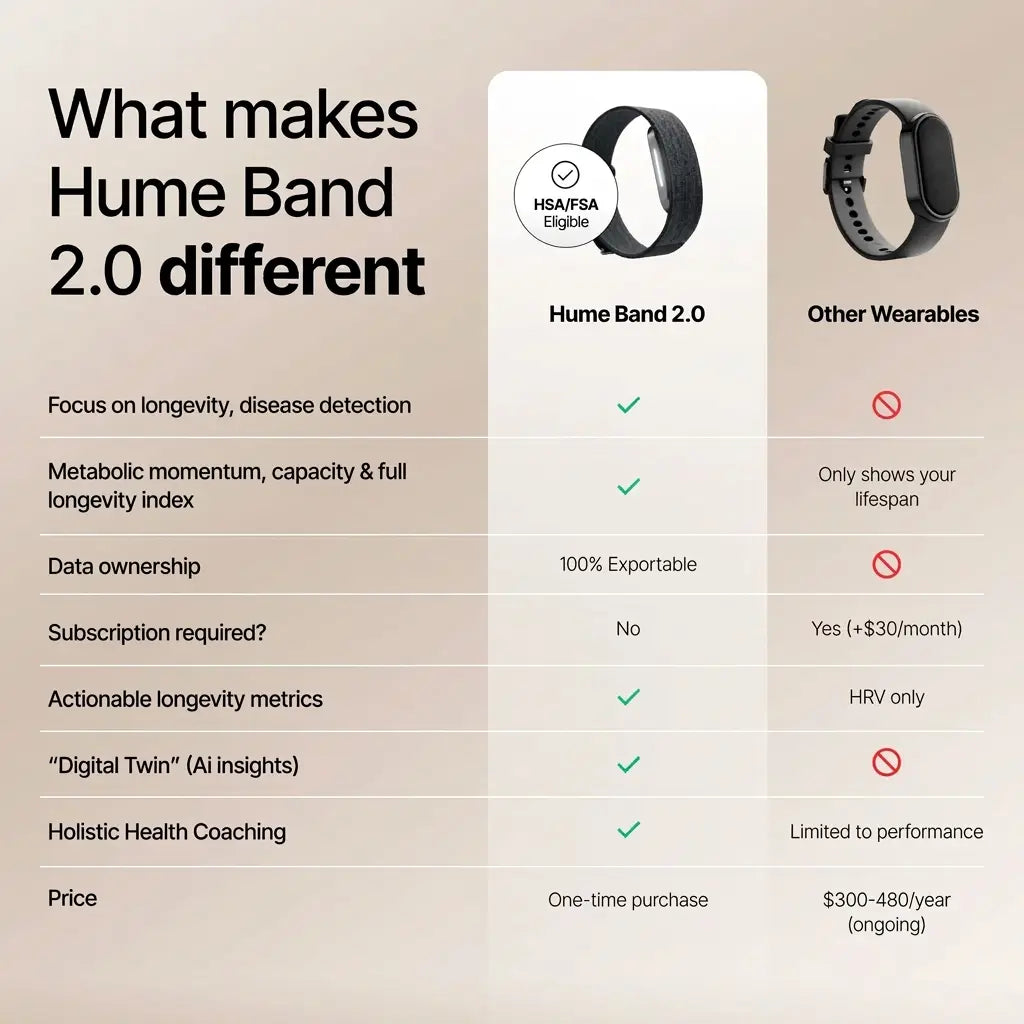
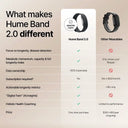
Comparison
Hume Band
Others
Focus
Longevity, disease detection,
healthspan
healthspan
Strain, recovery, athletic
performance, lifespan limited to
premium*
performance, lifespan limited to
premium*
Data Ownership
You own your health
data (exportable)
data (exportable)
You don’t own your
data (locked behind membership)
data (locked behind membership)
Subscription
Required?
Required?
No, One time purchase
with option to upgrade to premium
with option to upgrade to premium
Yes - $30/month (or more)
Body Composition
Tracking
Tracking
Yes, via Hume Pod
No
Digital Twin / AI
insights
insights
Yes, future-ready
predictive insights
predictive insights
No (basic insights only)
Holistic Health
Coaching
Coaching
Yes, Science-backed, longevity-
focused
focused
Limited to performance/recovery tips
Longevity Metrics
(HRV, Resilience)
(HRV, Resilience)
Yes, with longevity index,
metabolic momentum
and capacity
metabolic momentum
and capacity
HRV only
Price
One-time purchase: $199-$249 (no
subscription)
subscription)
$300-480/year (ongoing)
Your True Age
Coaching That Targets Aging — Not Just Strain
Other trackers focus on workouts and recovery.
Hume is a full longevity system — with tools for disease detection, aging, and health optimization.
Biological Age is a label.
Metabolic Capacity is a system.
 Hume says:
Hume says:
“Your momentum is 82. You gained 3.2 days of life last week — here’s how to gain more.”
“Your momentum is 82. You gained 3.2 days of life last week — here’s how to gain more.”
 Others say:
Others say:
“You’re biologically 37.”
“You’re biologically 37.”
We don’t just tell you how old you are.
We help you get younger — and prove it
We help you get younger — and prove it
Lifetime Access
No Monthly Fees to Access Your Own Health
Hume:
Hume: One-time purchase. Premium
optional*
optional*
Others:
Others: $30/month just to see
your data.
your data.
We believe your health data shouldn’t be locked behind a subscription.
With Hume Band, you own the device — and your insights. Forever.
With Hume Band, you own the device — and your insights. Forever.
Longevity
Real Longevity Metrics — Not Just HRV
Hume:
Hume: Metabolic Momentum, Capacity,
Resilience, and a full Longevity Index.
Resilience, and a full Longevity Index.
Others:
Others: Just lifespan. HRV is one
piece of the puzzle.
piece of the puzzle.
Hume gives you the whole picture — and shows how your body is actually changing over time.
Know Your Body
Direct Measurement — Not Just Inference
Others guess aging from HRV, sleep, and heart rate.
Hume measures it — directly.
The Hume Band + Hume Pod track real biomarkers in fat, muscle, and tissue — where aging actually
happens.
Inference is helpful.
But direct data is powerful.
Excellent | 5.0

How has Hume Band 2.0 helped people reach their goals?
“As a doctor, I’m impressed Most of my patients come in wanting a "magic pill" for longevity, but the truth is, daily habits matter more than anything. That’s why I was thrilled to discover the Hume Band. Unlike other wearables that focus on generic metrics, it tracks metabolic capacity—a key indicator of cellular health and aging. The data is presented in a way that’s accessible (no medical degree required!), and I’ve started recommending it to patients who want to take control of their health. One diabetic patient even reduced his insulin resistance by 20% after using the band’s insights to tweak his exercise and meal timing. For anyone serious about preventive health, this is a game-changer.
Read more
Brooklyn
 Verified Member
Verified Member
“I can’t say enough good things about the Hume Band. One of the most impressive features for me has been the Metabolic Capacity. It flagged signs of strain on my body before I even realized something was wrong—turns out I had a chest infection! Thanks to the early warning, I was able to get checked out and start treatment before things got worse. The Band itself is super comfortable to wear all day and night. It gives me detailed insights on how my habit is impacting my energy levels and how to increase my metabolic capacity, and now I truly listen to what my body needs. The app is really intuitive, and the health data feels incredibly personalized and accurate. If you’re looking for a smart health tracker that goes beyond tracking fitness and sleep, the Hume Band is the one. I genuinely feel more in tune with my health, and in this case, it may have even helped me catch a serious issue early. Highly recommended!
Read more
Savannah
Verified Member
Verified Member
“I bought this on a whim—now I can’t imagine life without it. I wasn’t sure what to expect, but the Hume Band has become my daily health coach. It tracks things I didn’t even know mattered (like metabolic momentum) and shows me exactly how my choices affect my body. The app is sleek and user-friendly, and I love the weekly reports. My partner saw my results and ordered one for himself—now we’re both hooked!
Read more
Jenny
Verified Member
Verified Member
“I’ve tried every health tracker out there, and the Hume Band is in a league of its own. Most wearables just count steps or monitor heart rate, but the Hume Band goes deeper—tracking metabolic momentum and capacity to show how my daily habits impact my long-term health. The app breaks everything down in a way that’s easy to understand, and I’ve already made small tweaks (like adjusting my meal timing and sleep routine) that have had a huge impact on my energy. If you’re serious about longevity, this is a must.
Read more
Emily
Verified Member
Verified Member
Frequently Asked Questions
What is the difference between Band 1.0 and Band 2.0?
- Improved accuracy
Better signal processing means more reliable health insights and clearer trends over time. - Blood pressure trends tracking
Instead of isolated readings, 2.0 shows how your blood pressure changes across days and habits. - 14-day battery life
Wear it longer, charge it less. Built for uninterrupted health tracking. - UltraLux strap
A more premium, comfortable, all-day wearable design. - Nutrition tracking (coming June)
Soon you'll be able to connect food intake with your body's response for deeper health insights.
What raw data does the Hume Band track and measure?
- Continuous heart rate monitoring
- Heart Rate Variability (HRV)
- Blood oxygen levels (SpO2)
- Sleep stages (light, deep, REM, awake)
- Sleep quality and efficiency
- Activity levels and movement patterns
- Strain and recovery
- Skin temperature
- Blood Pressure Insights (NEW)
What is “longevity,” and how does the Hume Band support it?
Longevity means living a longer, healthier life—free from preventable diseases. The Hume Band helps by continuously tracking and interpreting signals from your body to:
- Spot early signs of imbalance or chronic risk
- Monitor how daily habits impact your aging process
- Provide insights to improve healthspan—not just lifespan
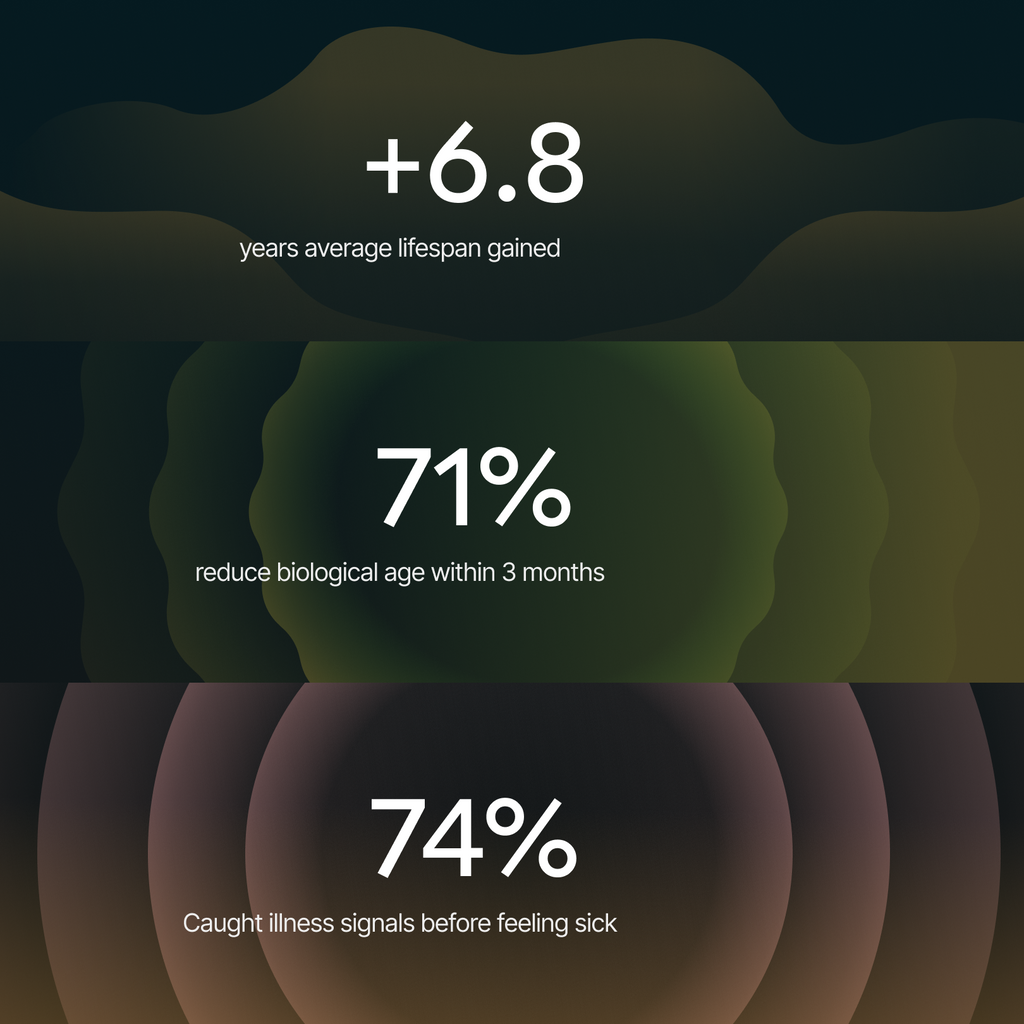
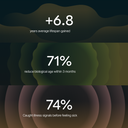
On average, Hume Band users gained an extra 39 days of life in their first year with Hume
Our tools are designed to help you make small changes that compound into big results over time.
Do I need a subscription to use the Band?
No subscription is required to use the Band or access your raw data.
However, if you'd like AI-driven insights, personalized longevity coaching, and deep health analysis, you can subscribe to Hume Premium starting at $8.99/month. This supports the computing power needed to deliver real-time, intelligent health feedback.
Is the Band waterproof or sweatproof?
Yes. The Hume Band is IP68-rated—meaning it's:
- Dustproof
- Water-resistant up to 1 meter (3.2 feet) for up to 2 hours
Perfect for showers, swimming, and workouts—no interruptions.
What is the battery life of the Hume Band?
- Up to 14 days of battery life with typical use
- Fast charging: Full charge in approximately 30 minutes
Note: Frequent syncing and continuous tracking may slightly reduce battery life.
Is the Band compatible with my phone?
Yes. The Hume Band works with:
iOS Devices
- iPhone 8 and newer
- iOS 14.0 and above
Android Devices
- Android 8.0 (Oreo) and above
Can I buy the Band without the Hume Pod?
Yes. The Hume Band works perfectly on its own for daily tracking.
The Hume Pod is an optional companion device that scans your body composition (body fat, muscle mass, etc.) for a more complete health picture—but it's not required.
What’s your return or exchange policy?
We offer a 45-day, no-questions-asked return or exchange policy. Return shipping costs apply.
Is my health data secure?
Yes. Your health data is:
- Encrypted end-to-end
- Stored on HIPAA-compliant servers
- Only accessible to you (or your authorized providers if you choose)
We prioritize your privacy and never sell your data. You’re in control at every step.