Free App + Free shipping included!
{
"type": "modal",
"contentType": "images",
"content": {
"title": "",
"images": ["//humehealth.com/cdn/shop/files/Modal_Always_Eligible.svg?v=1765544261&width=2000"]
},
"width": 750,
"transitionDuration": 150
}
{
"type": "slideout",
"contentType": "with_image",
"content": {
"title": "","image": "//humehealth.com/cdn/shop/files/10years.webp?v=1763051337&width=900",
"imageWidth": "200","imageContent": "\u003ch3\u003eAbout warranty\u003c\/h3\u003e\u003cp\u003eYou're investing in a decade of health tracking. The 10-Year Warranty gives your device the same long-term protection and ensures it stays covered and performing at its best for your entire journey ahead.\u003c\/p\u003e",
"secondaryContent": "\u003ch4\u003eComplete hardware and sensor coverage\u003c\/h4\u003e\u003cp\u003eEvery component of your device is protected for 10 years. This includes not just the device shell but all the advanced sensors that power your health insights. If anything goes wrong with the hardware or sensing technology, you're fully covered.\u003c\/p\u003e\u003ch4\u003eReliable accuracy, guaranteed\u003c\/h4\u003e\u003cp\u003ePrecision is what drives reliable health insights. With on-request servicing included, you can maintain that measurement quality throughout the entire decade. If you ever notice accuracy drift or want recalibration, just request service and we'll ensure your device is performing like new.\u003c\/p\u003e\u003ch4\u003eOne-time checkout pricing\u003c\/h4\u003e\u003cp\u003eThis discounted rate is only available now. Add the 10-Year Warranty at checkout for $46, or pay the full $70 if you decide to add it later. Lock in the best price today and never think about coverage again.\u003c\/p\u003e"
},
"width": 750,
"transitionDuration": 700
}
{
"type": "slideout",
"contentType": "images",
"content": {
"title": "",
"images": ["//humehealth.com/cdn/shop/files/accuracy_report_1.webp?v=1763137586&width=1785","//humehealth.com/cdn/shop/files/accuracy_report_2_0a60d4d8-95ee-4abc-a50d-9d0472a18b18.webp?v=1763137911&width=1785","//humehealth.com/cdn/shop/files/accuracy_report_3_476bfdf8-3500-41cc-95e8-4a1a15f0012e.webp?v=1763137922&width=1785"]
},
"width": 750,
"transitionDuration": 150
}
{
"type": "modal",
"contentType": "video",
"content": {
"title": "",
"video": "https://cdn.shopify.com/videos/c/o/v/85f4f6c396ad42bca85df3c9968fe377.mp4",
"autoplay": true
},
"width": 1024,
"transitionDuration": 700
}
{
"type": "slideout",
"content": {
"title": "45-Metric List",
"content": "\u003cp\u003e\u003cstrong\u003eCore totals (20)\u003c\/strong\u003e\u003c\/p\u003e\u003col\u003e\u003cli\u003eWeight\u003c\/li\u003e\u003cli\u003eBMI\u003c\/li\u003e\u003cli\u003eBody Fat Rate (aka body fat %)\u003c\/li\u003e\u003cli\u003eBody Fat Percentage\u003c\/li\u003e\u003cli\u003eFat Mass\u003c\/li\u003e\u003cli\u003eMuscle Mass\u003c\/li\u003e\u003cli\u003eSkeletal Muscle Mass\u003c\/li\u003e\u003cli\u003eMuscle vs Fat Ratio\u003c\/li\u003e\u003cli\u003eVisceral Fat\u003c\/li\u003e\u003cli\u003eMetabolic Age\u003c\/li\u003e\u003cli\u003eBasal Metabolic Rate (BMR)\u003c\/li\u003e\u003cli\u003eHydration (status\/level)\u003c\/li\u003e\u003cli\u003eWater Weight\u003c\/li\u003e\u003cli\u003eTotal Body Water (TBW)\u003c\/li\u003e\u003cli\u003eIntracellular Water (ICW)\u003c\/li\u003e\u003cli\u003eExtracellular Water (ECW)\u003c\/li\u003e\u003cli\u003eProtein Levels\u003c\/li\u003e\u003cli\u003eBone mineral content \/ “bone” metric (often marketed as bone density)\u003c\/li\u003e\u003cli\u003eHeart health \u003c\/li\u003e\u003cli\u003eFull-body segmental scan coverage (arms\/torso\/legs)\u003cbr\/\u003e\u003c\/li\u003e\u003c\/ol\u003e\u003cp\u003e\u003c\/p\u003e\u003cp\u003e\u003cstrong\u003eSegmental fat % (5)\u003c\/strong\u003e\u003c\/p\u003e\u003col\u003e\u003cli\u003eRight Arm Fat %\u003c\/li\u003e\u003cli\u003eLeft Arm Fat %\u003c\/li\u003e\u003cli\u003eTrunk Fat %\u003c\/li\u003e\u003cli\u003eRight Leg Fat %\u003c\/li\u003e\u003cli\u003eLeft Leg Fat %\u003cbr\/\u003e\u003c\/li\u003e\u003c\/ol\u003e\u003cp\u003e\u003c\/p\u003e\u003cp\u003e\u003cstrong\u003eSegmental muscle\/lean outputs (5)\u003cbr\/\u003e\u003c\/strong\u003e\u003c\/p\u003e\u003col\u003e\u003cli\u003eRight Arm Muscle\/Lean (segmental)\u003c\/li\u003e\u003cli\u003eLeft Arm Muscle\/Lean (segmental)\u003c\/li\u003e\u003cli\u003eTrunk Muscle\/Lean (segmental)\u003c\/li\u003e\u003cli\u003eRight Leg Muscle\/Lean (segmental)\u003c\/li\u003e\u003cli\u003eLeft Leg Muscle\/Lean (segmental)\u003c\/li\u003e\u003c\/ol\u003e\u003cp\u003e\u003c\/p\u003e\u003cp\u003e\u003cstrong\u003eSegmental muscle\/water balance ratings (5)\u003cbr\/\u003e\u003c\/strong\u003e\u003c\/p\u003e\u003col\u003e\u003cli\u003eRight Arm Muscle\/Water Balance %\u003c\/li\u003e\u003cli\u003eLeft Arm Muscle\/Water Balance %\u003c\/li\u003e\u003cli\u003eTorso Muscle\/Water Balance %\u003c\/li\u003e\u003cli\u003eRight Leg Muscle\/Water Balance %\u003c\/li\u003e\u003cli\u003eLeft Leg Muscle\/Water Balance %\u003c\/li\u003e\u003c\/ol\u003e\u003cp\u003e\u003c\/p\u003e\u003cp\u003e\u003cstrong\u003eSegmental intracellular-water health (5)\u003cbr\/\u003e\u003c\/strong\u003e\u003c\/p\u003e\u003col\u003e\u003cli\u003eRight Arm ICW health (segmental)\u003c\/li\u003e\u003cli\u003eLeft Arm ICW health (segmental)\u003c\/li\u003e\u003cli\u003eTorso ICW health (segmental)\u003c\/li\u003e\u003cli\u003eRight Leg ICW health (segmental)\u003c\/li\u003e\u003cli\u003eLeft Leg ICW health (segmental)\u003c\/li\u003e\u003c\/ol\u003e\u003cp\u003e\u003c\/p\u003e\u003cp\u003e\u003cstrong\u003eScoring + insights shown in creative (5)\u003cbr\/\u003e\u003c\/strong\u003e\u003c\/p\u003e\u003col\u003e\u003cli\u003eOverall Health Score\u003c\/li\u003e\u003cli\u003eBody Composition Grade\u003c\/li\u003e\u003cli\u003eActivity Grade\u003c\/li\u003e\u003cli\u003eSleep Grade\u003c\/li\u003e\u003cli\u003eRight-vs-left limb difference flag (lean\/muscle asymmetry callout)\u003cbr\/\u003e\u003c\/li\u003e\u003c\/ol\u003e"
},
"width": 750,
"transitionDuration": 150
}
{
"type": "slideout",
"content": {
"title": "11-modal",
"content": "\u003ch4\u003eLean Mass Preservation During GLP‑1-Assisted Weight Loss in Engaged Digital Health Program Participants\u003c\/h4\u003e\n\u003cp\u003e\u003ci\u003eAn Outcomes Analysis of 6,990 Hume Health Premium Members\n \u003c\/i\u003e\u003c\/p\u003e\n\u003cp\u003eHume Health Corp • Internal Outcomes Analysis • 2024\n Correspondence: research@humehealth.com • Methodology available on request\n\u003c\/p\u003e\n\u003ch4\u003eABSTRACT\u003c\/h4\u003e\n\u003cp\u003e\u003cb\u003eBackground.\u003c\/b\u003e GLP‑1 receptor agonists produce substantial weight loss but are associated with lean mass loss of\n 25–39%\n of total weight lost in published clinical trials. Lean mass is a primary determinant of resting metabolic rate, and\n its loss during weight reduction is associated with impaired weight maintenance following treatment cessation. This\n analysis examined lean mass outcomes in a real-world cohort of Hume Health premium platform members who met defined\n engagement criteria.\u003c\/p\u003e\n\u003cp\u003e\u003cb\u003eMethods.\u003c\/b\u003e Retrospective analysis of 6,990 Hume Health premium members on GLP‑1 therapy who completed a minimum\n of\n three body composition measurements per week via the Hume Body (8-sensor bioelectrical impedance analysis) and made\n weekly attestations of adherence to Pro.f AI protocol guidance. Body composition was measured at each weigh-in. The\n primary outcome was lean mass loss as a percentage of total weight lost, assessed from highest recorded weight (peak)\n to lowest recorded weight (nadir). Weighted mean lean mass loss was computed as the ratio of aggregate lean mass\n change to aggregate total weight lost across the full cohort.\u003c\/p\u003e\n\u003cp\u003e\u003cb\u003eResults.\u003c\/b\u003e Mean baseline weight was 105.3 kg (SD 21.8). Mean total weight lost was 21.9 kg (SD 6.8),\n representing 21.3%\n of baseline body weight. The weighted mean lean mass loss as a percentage of total weight lost was 16.9%. The median\n lean mass loss as a percentage of total weight lost was 19.4%. A total of 12.7% of members preserved or increased lean\n mass over the measurement period. Among the 87.3% of members who lost lean mass, mean lean mass loss as a percentage\n of total weight lost was 22.0%.\n\u003c\/p\u003e\n\u003cp\u003e\u003cb\u003e\n Conclusions. \u003c\/b\u003e Hume Health premium members on GLP‑1 therapy demonstrated lean mass loss substantially below the\n 25–39%\n range documented in published clinical trials. These results are consistent with the hypothesis that\n high-frequency\n body composition monitoring combined with AI-guided protocol adherence supports favorable body composition\n outcomes\n during medically assisted weight loss.\u003c\/p\u003e\n\u003cp\u003e\u003cb\u003eKeywords:\u003c\/b\u003e \u003ci\u003eGLP‑1 receptor agonists; lean mass preservation; body composition; semaglutide; weight loss;\n bioelectrical impedance analysis; digital health\u003c\/i\u003e\u003c\/p\u003e\n \n\u003ch4\u003e1. INTRODUCTION\u003c\/h4\u003e\n\u003cp\u003eGlucagon-like peptide-1 (GLP‑1) receptor agonists represent a substantial advance in pharmacological obesity\n management. In the STEP 1 clinical trial, once-weekly subcutaneous semaglutide 2.4 mg produced mean total body weight\n loss of 14.9% over 68 weeks, compared to 2.4% in the placebo group receiving lifestyle intervention alone —\n approximately 6.2 times greater weight loss than lifestyle intervention alone.¹\u003c\/p\u003e\n\u003cp\u003eHowever, a consistent finding across GLP‑1 clinical trials is that a meaningful proportion of weight lost derives\n from lean tissue rather than adipose tissue. Neeland et al. documented lean mass reductions of 40–60% of total weight\n lost in some GLP‑1 trial cohorts, with substantial heterogeneity across studies.² Prado et al., in a commentary in The\n Lancet Diabetes \u0026 Endocrinology, reported lean mass loss of 25–39% of total weight lost across medically induced\n weight loss programs.³\u003c\/p\u003e\n\u003cp\u003eThis is clinically significant because skeletal muscle mass is a primary determinant of resting metabolic rate (RMR)\n — the baseline energy expenditure that determines whether a patient can sustain their new body weight after treatment\n ends.⁶ In the STEP 1 extension trial, participants who discontinued semaglutide without a structured metabolic exit\n protocol regained two-thirds of their prior weight loss within one year of stopping treatment.⁴\u003c\/p\u003e\n\u003cp\u003eThe Hume Health platform combines GLP‑1 therapy with high-frequency body composition measurement via bioelectrical\n impedance analysis (BIA), physician oversight informed by longitudinal tissue-level data, and an AI guidance system\n (Pro.f) that surfaces body composition patterns for clinical review and member adherence. This analysis examines\n whether this protocol-supported approach is associated with lean mass outcomes below published benchmarks.\n\u003c\/p\u003e\n \n\u003ch4\u003e2. METHODS\n\u003c\/h4\u003e\n\u003cp\u003e\u003cb\u003e2.1 Study Design\u003c\/b\u003e\u003c\/p\u003e\n\u003cp\u003eThis was a retrospective cohort analysis of real-world member data from the Hume Health platform. The analysis period\n spanned active program enrollment through March 2026. The study was conducted under Hume Health Corp internal data\n governance protocols. Member data were de-identified prior to analysis. The study did not constitute human subjects\n research requiring institutional review board oversight under 45 CFR 46 as it involved retrospective analysis of\n de-identified operational data.\u003c\/p\u003e\n\u003cp\u003e\u003cb\u003e2.2 Participants\n \u003c\/b\u003e\u003c\/p\u003e\n\u003cp\u003eEligible participants were Hume Health premium members who: (1) were actively enrolled in a GLP‑1 therapy program\n during the analysis period; (2) completed a minimum of three Hume Body body composition measurements per week\n throughout the measurement window; and (3) completed weekly attestations confirming engagement with and adherence to\n Pro.f AI protocol guidance. Members who did not meet all three criteria were excluded from analysis.\u003c\/p\u003e\n\u003cp\u003e\u003cb\u003e2.3 Measurements\u003c\/b\u003e\u003c\/p\u003e\n\u003cp\u003eBody weight and body composition were measured at each weigh-in using the Hume , a bioelectrical impedance analysis\n device measuring whole-body and segmental lean mass, fat mass, and total body water. BIA measurements were recorded at\n consistent times relative to weigh-in. Lean mass at peak weight (highest recorded body weight during the measurement\n window) and lean mass at nadir weight (lowest recorded body weight) were identified for each member. Lean mass delta\n was computed as lean mass at nadir minus lean mass at peak. Weight loss was computed as peak weight minus nadir\n weight.\n\u003c\/p\u003e\n\u003cp\u003eLean mass loss as a percentage of total weight lost was computed for each member as: (|lean mass delta| \/ weight\n loss) × 100, where lean mass delta was negative for members who lost lean mass and positive for members who preserved\n or gained lean mass. The primary aggregate outcome — weighted mean lean mass loss as a percentage of total weight lost\n — was computed as: (sum of lean mass deltas across all members \/ sum of total weight lost across all members) × 100,\n reflecting the population-level ratio of lean mass change to total weight change.\n\u003c\/p\u003e\n\u003cp\u003e\u003cb\u003e2.4 Statistical Analysis\u003c\/b\u003e\u003c\/p\u003e\n\u003cp\u003eDescriptive statistics were computed for all primary and secondary outcomes. Continuous variables are reported as\n mean (standard deviation) and median. The weighted mean was used as the primary outcome measure for lean mass loss as\n a percentage of total weight lost, as it accounts for variation in total weight lost across members and reflects the\n aggregate population-level body composition response. Members who preserved or gained lean mass during the measurement\n period (lean mass delta ≥ 0) are included in all analyses; their inclusion in the weighted mean computation reduces\n the aggregate lean mass loss percentage relative to analyses restricted to members with lean mass loss.\u003c\/p\u003e\n\u003ch4\u003e3. RESULTS\u003c\/h4\u003e\n\u003cp\u003e\u003cb\u003e3.1 Participant Characteristics\u003c\/b\u003e\u003c\/p\u003e\n\u003cp\u003eA total of 6,990 members met all eligibility criteria and were included in the analysis. Baseline characteristics are\n presented in Table 1.\u003c\/p\u003e\n \n\u003cdiv class=\"table_drawer\"\u003e\n \u003cp\u003eTable 1. Baseline Participant Characteristics (n = 6,990)\u003c\/p\u003e\n \u003ctable border=\"1\"\u003e\n \u003ctr\u003e\n \u003cth\u003eCharacteristic\u003c\/th\u003e\n \u003cth\u003eValue\u003c\/th\u003e\n \u003c\/tr\u003e\n \u003ctr\u003e\n \u003ctd\u003eSample size (n)\u003c\/td\u003e\n \u003ctd\u003e6,990\u003c\/td\u003e\n \u003c\/tr\u003e\n \u003ctr\u003e\n \u003ctd\u003eMean baseline weight, kg (SD)\u003c\/td\u003e\n \u003ctd\u003e105.3 (21.8)\u003c\/td\u003e\n \u003c\/tr\u003e\n \u003ctr\u003e\n \u003ctd\u003eMedian baseline weight, kg\u003c\/td\u003e\n \u003ctd\u003e102.3\u003c\/td\u003e\n \u003c\/tr\u003e\n \u003ctr\u003e\n \u003ctd\u003eMeasurement frequency (minimum)\u003c\/td\u003e\n \u003ctd\u003e3 weigh-ins per week\u003c\/td\u003e\n \u003c\/tr\u003e\n \u003ctr\u003e\n \u003ctd\u003eProof engagement attestation\u003c\/td\u003e\n \u003ctd\u003eWeekly (required for inclusion)\u003c\/td\u003e\n \u003c\/tr\u003e\n \u003c\/table\u003e\n\u003c\/div\u003e\n \n\u003cp\u003e\u003cb\u003e3.2 Weight Loss Outcomes\n \u003c\/b\u003e\u003c\/p\u003e\n\u003cp\u003eMean total weight lost was 21.9 kg (SD 6.8), representing a mean reduction of 21.3% (SD 6.7%) of baseline body\n weight. Median weight lost was 19.6 kg, representing 20.0% of baseline body weight. Weight loss outcomes are presented\n in Table 2.\u003c\/p\u003e\n \n\u003cp\u003eTable 2. Weight Loss Outcomes\u003c\/pp\u003e\n\u003cdiv class=\"table_drawer2\"\u003e\n \u003ctable border=\"1\"\u003e\n \u003ctr\u003e\n \u003cth\u003eOutcome\u003c\/th\u003e\n \u003cth\u003eResult\u003c\/th\u003e\n \u003c\/tr\u003e\n \u003ctr\u003e\n \u003ctd\u003eMean weight loss, kg (SD)\u003c\/td\u003e\n \u003ctd\u003e21.9 (6.8)\u003c\/td\u003e\n \u003c\/tr\u003e\n \u003ctr\u003e\n \u003ctd\u003eMedian weight loss, kg\u003c\/td\u003e\n \u003ctd\u003e19.6\u003c\/td\u003e\n \u003c\/tr\u003e\n \u003ctr\u003e\n \u003ctd\u003eMean weight loss, % of baseline (SD)\u003c\/td\u003e\n \u003ctd\u003e21.3% (6.7%)\u003c\/td\u003e\n \u003c\/tr\u003e\n \u003ctr\u003e\n \u003ctd\u003eMedian weight loss, % of baseline\u003c\/td\u003e\n \u003ctd\u003e20.0%\u003c\/td\u003e\n \u003c\/tr\u003e\n \u003ctr\u003e\n \u003ctd\u003eMinimum weight loss, kg\u003c\/td\u003e\n \u003ctd\u003e15.7\u003c\/td\u003e\n \u003c\/tr\u003e\n \u003ctr\u003e\n \u003ctd\u003eMaximum weight loss, kg\u003c\/td\u003e\n \u003ctd\u003e75.4\u003c\/td\u003e\n \u003c\/tr\u003e\n \u003c\/table\u003e\n\u003c\/div\u003e\n\u003cp\u003e\u003cb\u003e3.3 Lean Mass Outcomes\u003c\/b\u003e\u003c\/p\u003e\n\u003cp\u003eThe weighted mean lean mass loss as a percentage of total weight lost was 16.9% across all 6,990 members. The median\n lean mass loss as a percentage of total weight lost was 19.4%. A total of 890 members (12.7%) preserved or increased\n lean mass over the measurement period (lean mass delta ≥ 0). Among the 6,100 members (87.3%) who lost lean mass, the\n mean lean mass loss as a percentage of total weight lost was 22.0%. Lean mass outcomes are presented in Table 3.\u003c\/p\u003e\n \n\u003cp\u003eTable 3. Lean Mass Outcomes\u003c\/p\u003e\n\u003cdiv class=\"table_drawer3\"\u003e\n \u003ctable border=\"1\"\u003e\n \u003ctr\u003e\n \u003cth\u003eOutcome\u003c\/th\u003e\n \u003cth\u003eResult\u003c\/th\u003e\n \u003c\/tr\u003e\n \u003ctr\u003e\n \u003ctd\u003eWeighted mean lean mass loss, % of total weight lost (all members)\u003c\/td\u003e\n \u003ctd\u003e16.9%\u003c\/td\u003e\n \u003c\/tr\u003e\n \u003ctr\u003e\n \u003ctd\u003eMedian lean mass loss, % of total weight lost (all members)\u003c\/td\u003e\n \u003ctd\u003e19.4%\u003c\/td\u003e\n \u003c\/tr\u003e\n \u003ctr\u003e\n \u003ctd\u003eMembers preserving or gaining lean mass, n (%)\u003c\/td\u003e\n \u003ctd\u003e890 (12.7%)\u003c\/td\u003e\n \u003c\/tr\u003e\n \u003ctr\u003e\n \u003ctd\u003eMembers losing lean mass, n (%)\u003c\/td\u003e\n \u003ctd\u003e6,100 (87.3%)\u003c\/td\u003e\n \u003c\/tr\u003e\n \u003ctr\u003e\n \u003ctd\u003eMean lean mass loss, % of total weight lost (among those with lean mass loss)\u003c\/td\u003e\n \u003ctd\u003e22.0%\u003c\/td\u003e\n \u003c\/tr\u003e\n \u003ctr\u003e\n \u003ctd\u003ePublished benchmark (Prado et al., 2024; Neeland et al., 2024)\u003c\/td\u003e\n \u003ctd\u003e25–39% (range across GLP-1 trials)\u003c\/td\u003e\n \u003c\/tr\u003e\n \u003c\/table\u003e\n\u003c\/div\u003e\n \n\u003cp\u003e\u003cb\u003e3.4 Interpretation of the Weighted Mean Outcome\u003c\/b\u003e\u003c\/p\u003e\n\u003cp\u003eThe weighted mean of 16.9% reflects the aggregate population-level ratio of total lean mass change to total weight\n lost across all members. Because members who preserved or gained lean mass (12.7% of the cohort) contribute negative\n lean mass loss values to the numerator, the weighted mean is lower than the mean computed among members who lost lean\n mass exclusively (22.0%). Both measures are reported to provide transparency regarding cohort composition. The\n weighted mean is the primary outcome because it most accurately represents the population-level body composition\n impact of the program.\u003c\/p\u003e\n\u003ch4\u003e4. DISCUSSION\n\u003c\/h4\u003e\n\u003cp\u003eThis analysis demonstrates that Hume Health premium members on GLP‑1 therapy, who met defined body composition\n monitoring and AI protocol engagement criteria, experienced lean mass loss substantially below the benchmarks\n documented in published GLP‑1 clinical trials. The weighted mean lean mass loss of 16.9% of total weight lost compares\n favorably to the 25–39% range reported by Prado et al.³ and the 40–60% upper range reported in some cohorts by Neeland\n et al.²\n\u003c\/p\u003e\n\u003cp\u003eThe mechanism by which frequent body composition measurement and protocol-guided engagement may attenuate lean mass\n loss is consistent with established physiology. Skeletal muscle mass is the primary determinant of resting metabolic\n rate.⁶ Interventions that preserve lean mass during caloric restriction — including higher protein intake, resistance\n exercise, and dose calibration timed to body composition response — are documented to reduce lean mass loss during\n weight reduction. The Hume platform protocol facilitates tissue-level visibility that enables these calibrations in\n near real-time; the present analysis cannot isolate which components of the program contributed to the observed\n outcomes.\n\u003c\/p\u003e\n\u003cp\u003eThe finding that 12.7% of members preserved or gained lean mass during GLP‑1-assisted weight loss is notable. This\n subgroup is likely influenced by favorable baseline characteristics, behavioral factors, and variability in BIA\n measurement across conditions, and should not be interpreted as a program-level guarantee of lean mass preservation.\n Its inclusion in the weighted mean reduces the reported aggregate lean mass loss figure relative to analyses\n restricted to members who lost lean mass.\u003c\/p\u003e\n\u003cp\u003e\u003cb\u003e4.1 Limitations\n \u003c\/b\u003e\u003c\/p\u003e\n\u003cp\u003eThis analysis has several limitations that should be considered when interpreting results. First, the study is\n retrospective and observational, without a concurrent control group. Comparison to published clinical trial benchmarks\n involves differences in population, measurement methodology, and GLP‑1 agent. Second, body composition was measured\n via bioelectrical impedance analysis rather than dual-energy X-ray absorptiometry (DXA) or magnetic resonance imaging\n (MRI), which are considered the reference standards for lean mass quantification. BIA measurements are sensitive to\n hydration status, time of measurement, and device calibration, and may produce systematic differences relative to\n DXA-derived lean mass values. Third, the cohort consists of premium-tier members who met a minimum engagement\n threshold; results may not generalize to members with lower engagement frequency or to non-engaged GLP‑1 users.\n Fourth, no information on dietary protein intake, resistance exercise participation, or specific GLP‑1 agent and\n dosing schedule was incorporated into this analysis, and these variables are likely to influence lean mass outcomes.\n Fifth, the duration of the measurement window varied across members and was determined by the interval between peak\n and nadir weight rather than a fixed protocol period.\u003c\/p\u003e\n\u003cp\u003e\u003cb\u003e4.2 Future Directions\u003c\/b\u003e\u003c\/p\u003e\n\u003cp\u003eProspective controlled study designs with standardized measurement protocols, dietary and exercise co-variate\n capture, and DXA-validated BIA calibration would provide stronger evidence for the role of high-frequency monitoring\n and AI-guided adherence in lean mass preservation during GLP‑1 therapy. Subgroup analyses examining the impact of\n engagement frequency, protein intake, resistance training participation, and GLP‑1 agent on lean mass outcomes would\n further characterize the mechanisms underlying these findings.\u003c\/p\u003e\n\u003cp\u003e\u003cb\u003e5. CONCLUSIONS\u003c\/b\u003e\u003c\/p\u003e\n\u003cp\u003eAmong 6,990 Hume Health premium members on GLP‑1 therapy who met defined body composition monitoring and AI protocol\n engagement criteria, the weighted mean lean mass loss as a percentage of total weight lost was 16.9%. This is\n substantially below the 25–39% range reported in published GLP‑1 clinical trial literature. The median lean mass loss\n was 19.4%. These findings are consistent with the hypothesis that high-frequency tissue-level monitoring, combined\n with AI-guided protocol adherence and physician oversight informed by body composition data, supports favorable lean\n mass outcomes during medically assisted weight loss. Prospective controlled research is needed to confirm these\n findings and to isolate the active components of the platform protocol.\n\u003c\/p\u003e\n \n\u003ch4\u003eREFERENCES\u003c\/h4\u003e\n \n\u003cp\u003e1. Wilding JPH, Batterham RL, Calanna S, et al. Once-Weekly Semaglutide in Adults with Overweight or Obesity. N Engl\n J Med. 2021;384(11):989–1002. doi:10.1056\/NEJMoa2032183.\u003c\/p\u003e\n\u003cp\u003e2. Neeland IJ, Linge J, Birkenfeld AL. Changes in lean body mass with glucagon-like peptide-1-based therapies and\n mitigation strategies. Diabetes Obes Metab. 2024;26(Suppl 4):16–27. doi:10.1111\/dom.15728.\u003c\/p\u003e\n\u003cp\u003e3. Prado CM, Phillips SM, Gonzalez MC, Heymsfield SB. Muscle matters: the effects of medically induced weight loss on\n skeletal muscle. Lancet Diabetes Endocrinol. 2024;12(11):785–787. doi:10.1016\/S2213-8587(24)00272-9.\u003c\/p\u003e\n\u003cp\u003e4. Wilding JPH, Batterham RL, Davies M, et al. Weight regain and cardiometabolic effects after withdrawal of\n semaglutide: The STEP 1 trial extension. Diabetes Obes Metab. 2022;24(8):1553–1564. doi:10.1111\/dom.14725.\u003c\/p\u003e\n\u003cp\u003e5. Hume Health Corp. Lean Mass Preservation in GLP‑1 Members: An Internal Outcomes Analysis. 2024. Analysis of 6,990\n premium members. Methodology available on request: research@humehealth.com.\n\u003c\/p\u003e\n\u003cp\u003e6. Ravussin E, Bogardus C. Skeletal muscle metabolism is a major determinant of resting energy expenditure. J Appl\n Physiol. 1989;66(3). PMID:2243122.\n\u003c\/p\u003e\n \n\u003cp\u003e\u003cb\u003eDisclosure Statement\n \u003c\/b\u003e\u003c\/p\u003e\n\u003cp\u003eThis analysis was conducted by Hume Health Corp using data from the Hume Health platform. Hume Health Corp is the\n developer of the body composition monitoring hardware (Hume Body Pod) and AI guidance system (Pro.f) evaluated in this\n analysis. No external funding was received. The analysis has not undergone independent peer review. Investigators have\n an inherent commercial interest in the outcomes described.\u003c\/p\u003e"
},
"width": 750,
"transitionDuration": 150
}


HSA/FSA eligible


See it in action


(4.8/5.0) 48,252 Reviews
The Hume Pod
13,152.00TL
8,548.80TL

229 entries to win a G-Wagon

HSA | FSA Accepted
80% of people fail to maintain their health goals. Hume Body Analyzer are a simple and effective solution to stay motivated and keep track of your health.
The Hume Pod
13,152.00TL
8,229.21TL

80% of people fail to maintain their health goals. Hume Body Analyzer are a simple and effective solution to stay motivated and keep track of your health.

HSA/FSA eligible
See it in action


45-Day Return Policy

Free Worldwide Shipping
Choose Warranty Protection:

1 Year - Included

10 Years - 1,631.00TL
ADD TO CART 13,152.00TL8,229.21TL
HumeCare Band Lifetime Warranty
Our LIFETIME Warranty is now available for an incredibly low price. Add one to each The science scale and if anything ever goes wrong with it, send it back for a brand new one!
✔︎ Selected by 82% of our customers
Only 2,330.00 TRY
or 4 payments of 2,137.20TL with
Pay with HSA/FSA
Save an average of 30%
Learn More

Be included in the next available batch on
May 28th
Selling out fast.
Next Batch Ships:
May 22nd
100% Full
May 28th
70% Full
December 30th
0% Full
Our 7x sold-out and 2x award-winning Hume Pod
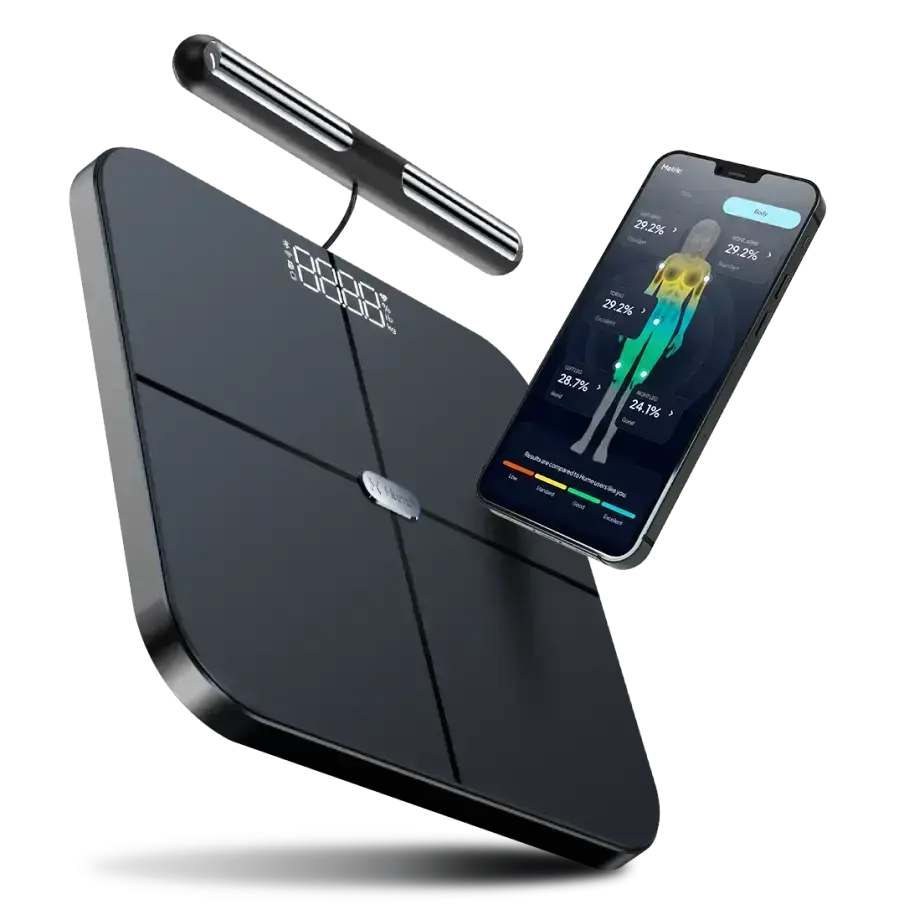
Your gateway to complete body insight right from the comfort of home. Say goodbye to guesswork and
hello to targeted results as can finally see the relationship between nutrition, activity, and your
body's well-being.
-
Reach health and weight goals 12x faster. -
No more weight plateau. Understand which areas to work on. -
Stay motivated with real-time feedback. -
Easily track your progress and see how far you've come. -
Made for the whole family — connect up to 24 devices.
The Hume Pod is rigorously tested for accuracy and are the only portable device used in clinics. See accuracy report here
Comparison
How the Hume Pod stacks up?
Benefits
Accuracy
Personalized Insights
Coaching & Feedback
Price
HSA/FSA Eligible
Weekly Health Reports
Personalized Health Programs
Hume Pod
98% Accuracy
$229
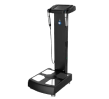
Medical grade analyzer
98% Accuracy
$25,000
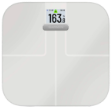
Other smart
scale
89% Accuracy
$80
June 21, 2025
"As a biohacker, I've tried countless body analyzers, and Hume's Pod is one of the most accurate I've found for tracking fat and
muscle mass. Precision matters because body composition-not just weight-is what really drives longevity, performance, and metabolic health."

Spend smart with your HSA or FSA 💰
Make your money go further
We handle eligibility. Guaranteed.
Receipts, handled
Forget filing for reimbursements. We got you.
Don't have your HSA/FSA card handy?
Use your credit card. We'll help with the rest.
Built by scientists. Proven by champions.
From world champions to everyday heroes, Hume Health is the future of human performance and longevity

Tim Bio-Hacker
Europe’s Leading Biohacker


Sarah Bacon
Olympian - Silver Medalist l 3x World Silver Medalist l 5x NCAA Champion

Belal Muhammad
2x UFC World Champion
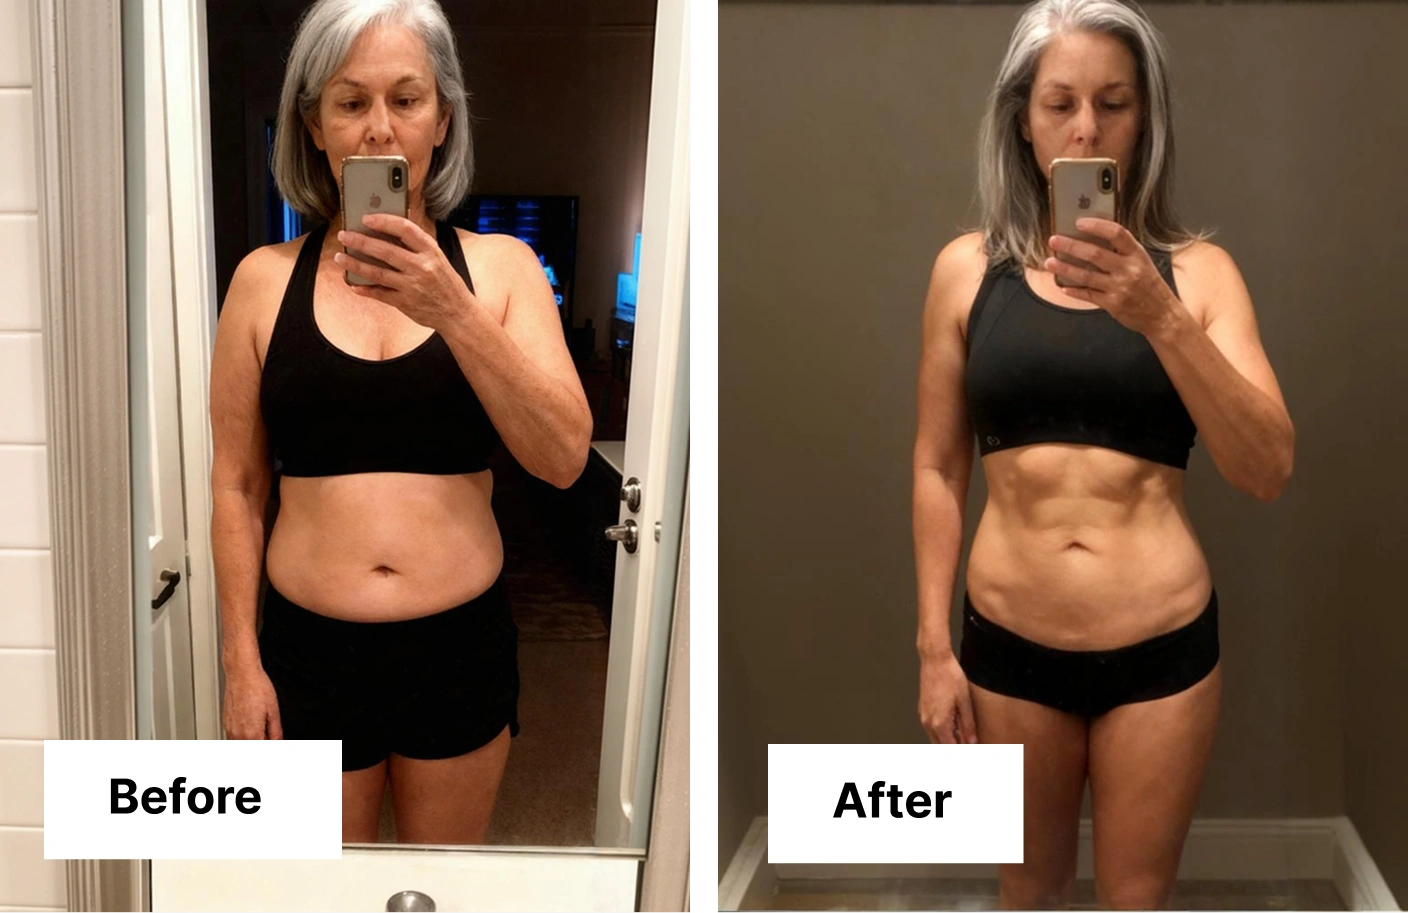
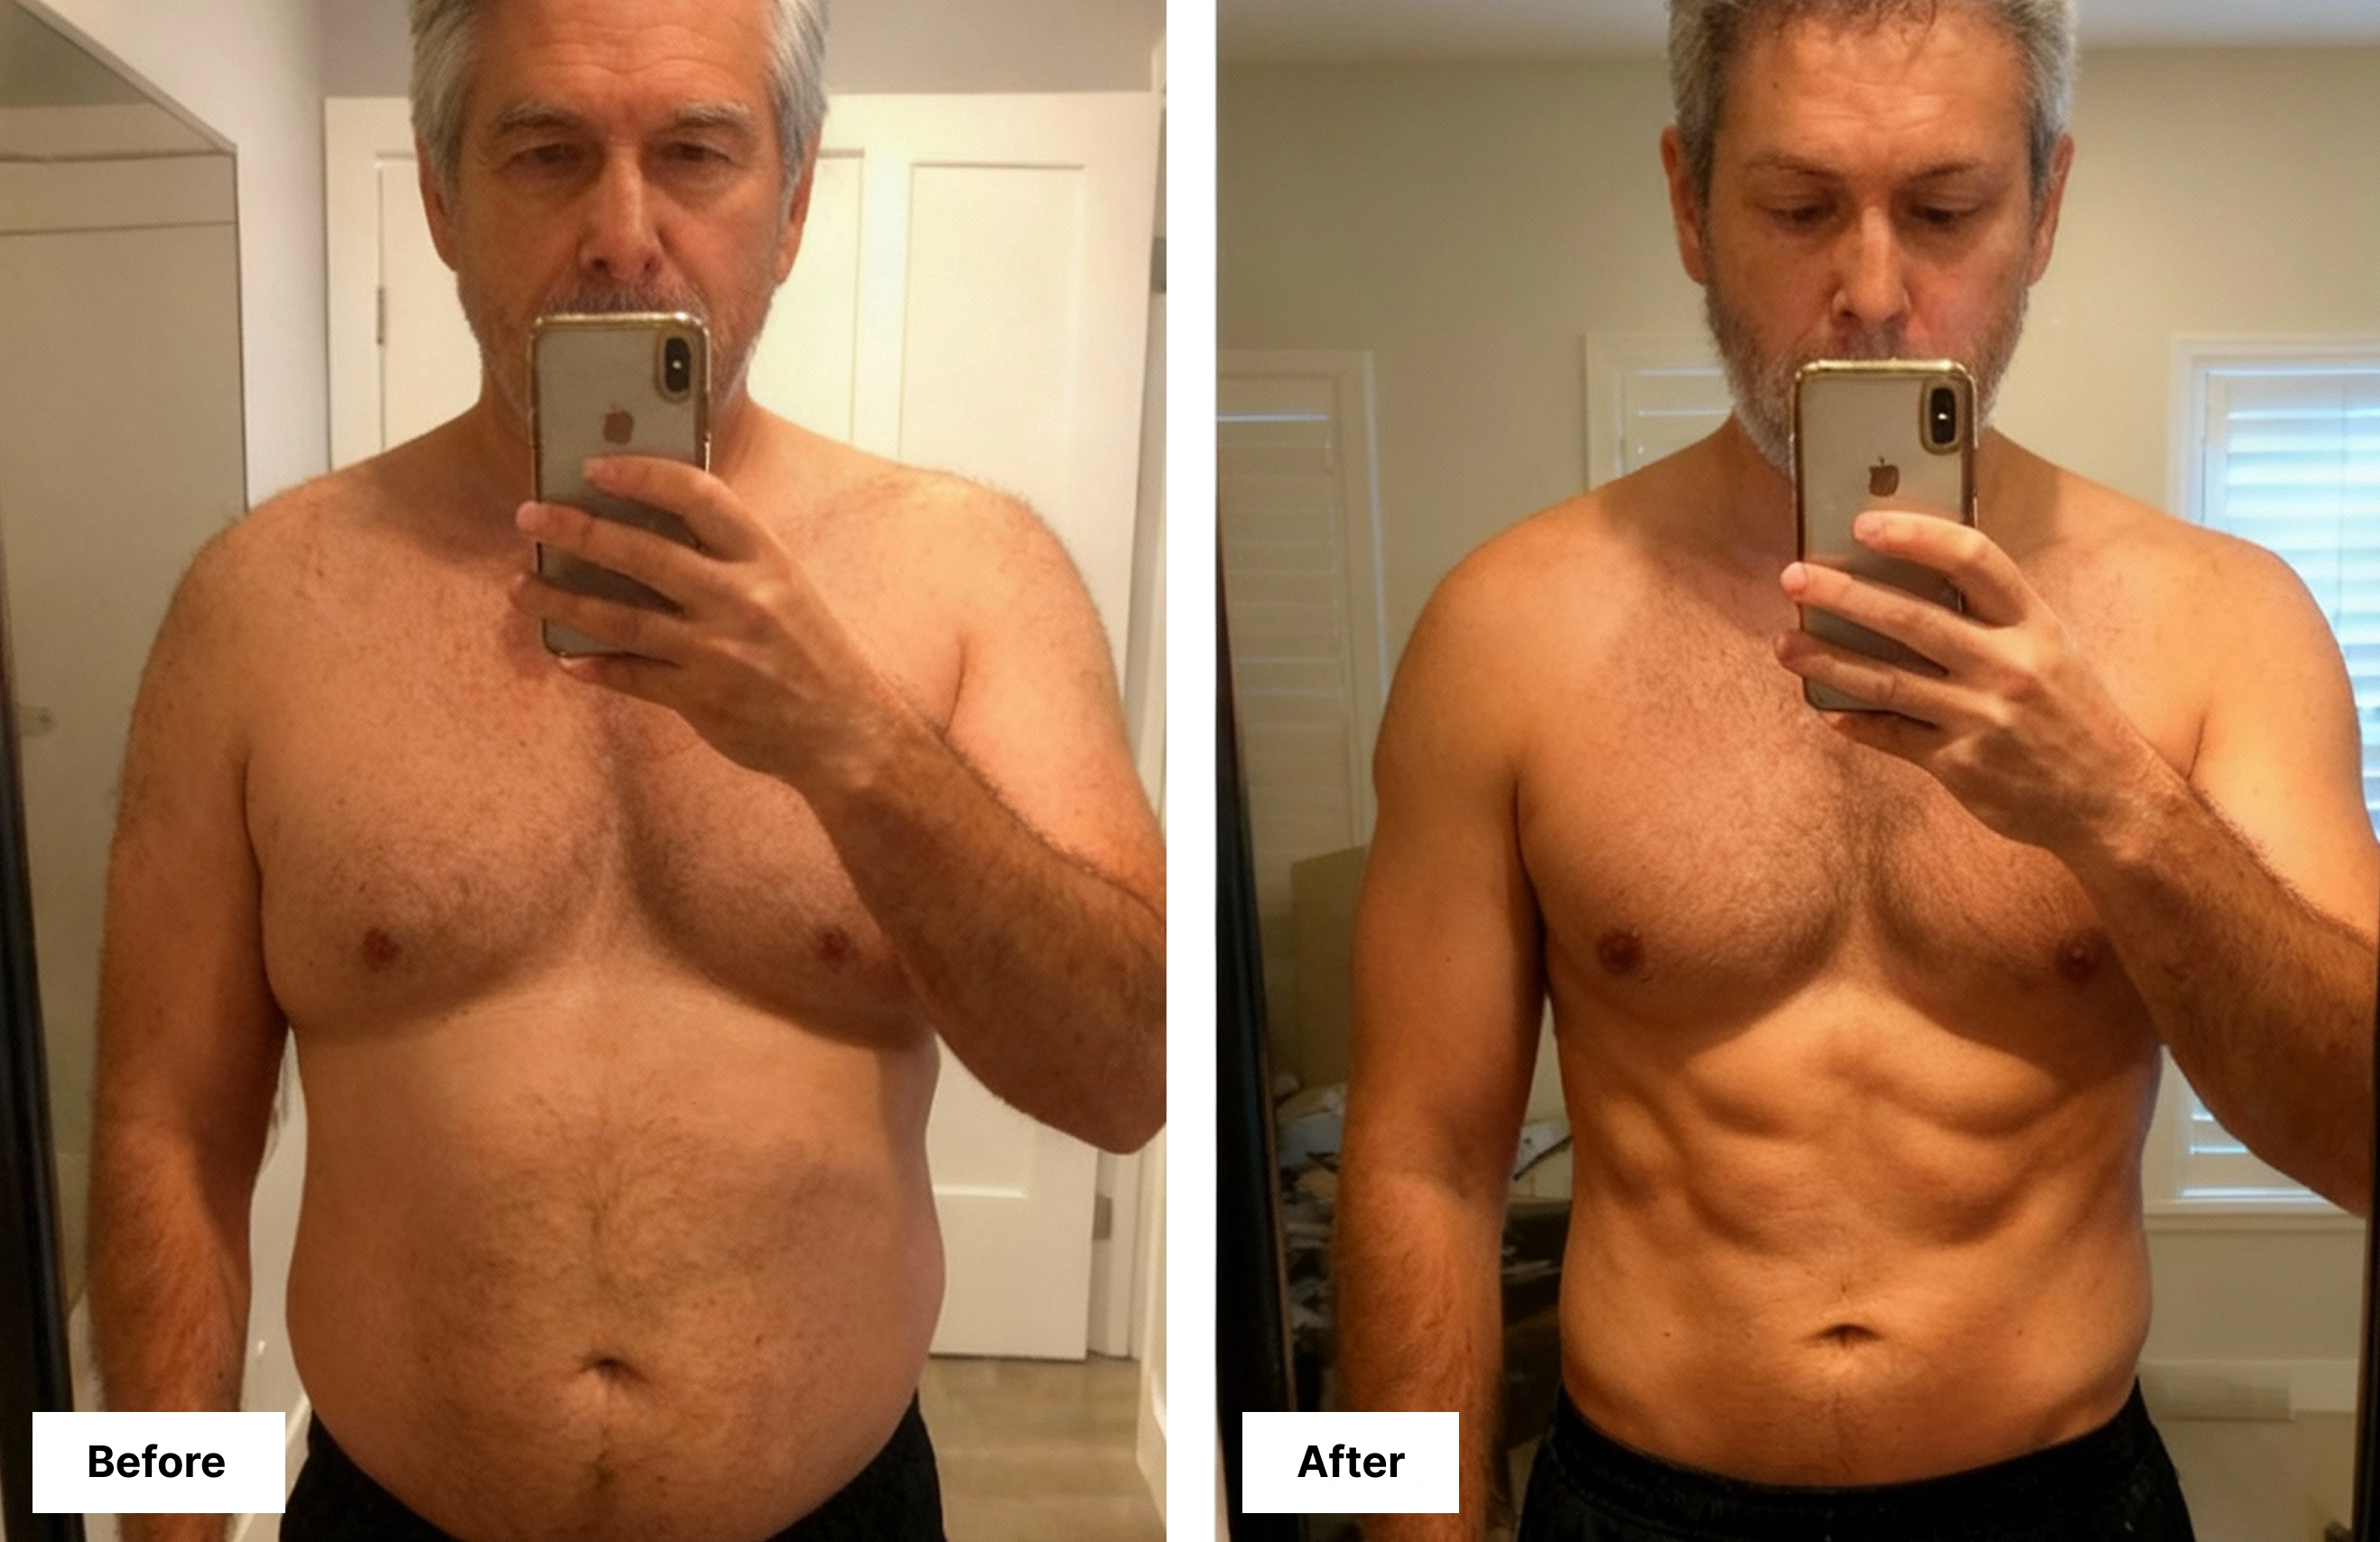
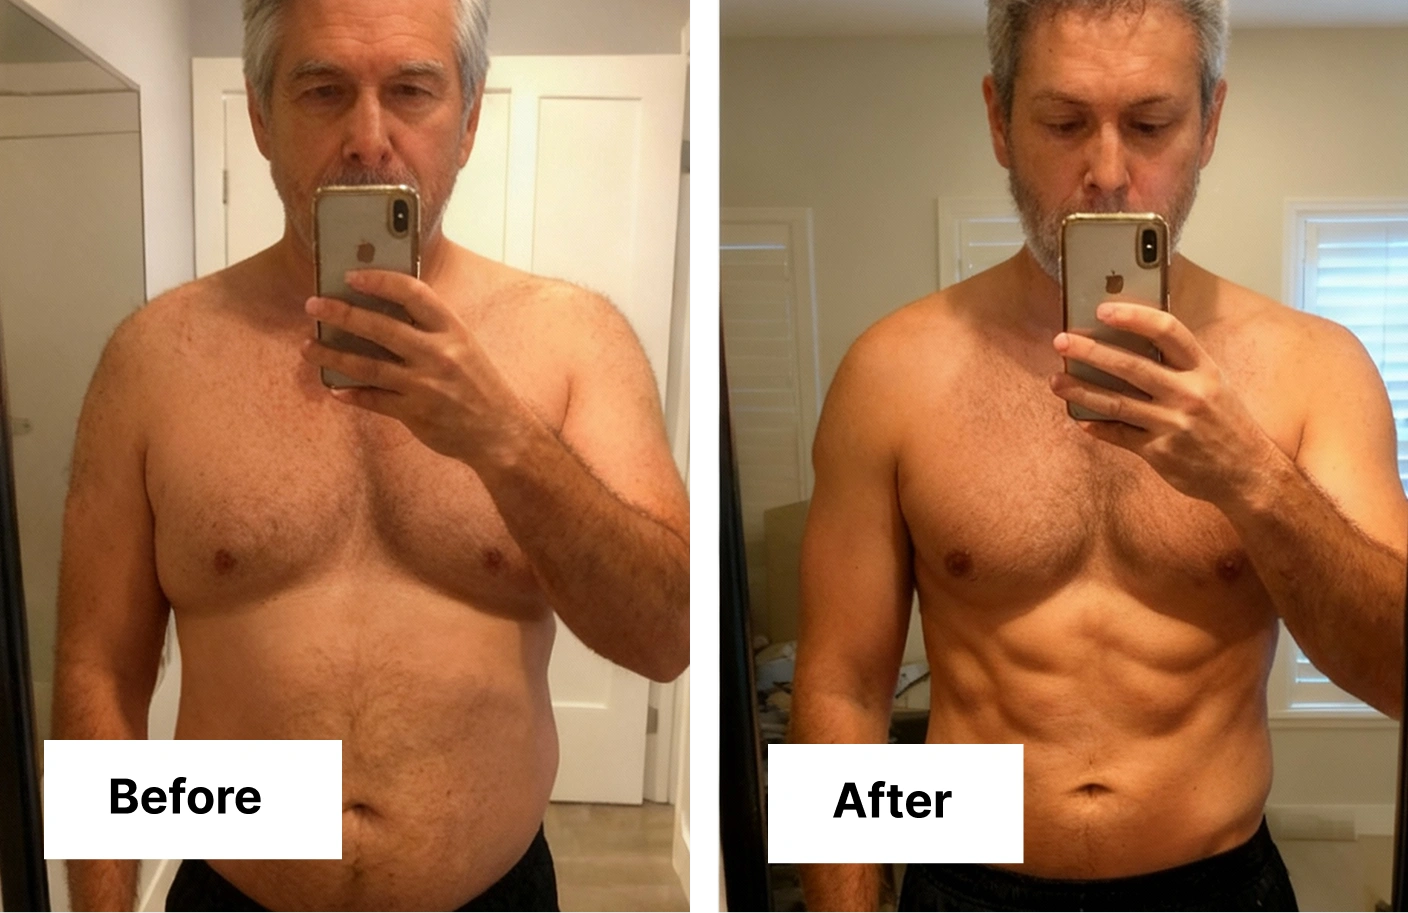
"Being able to see my muscle up and fat down while my weight isn’t moving has kept me very motivated to continue with my program"
Hume User


Brianna McNeal
Olympic Runner
"I’ve been in this industry for 8 years and I’ve not seen a home body analyzer this accurate! I’ve recommended this to all my client"
Hume User

Emily Loogman
T&F All-American l 3x CF Games l Hybrid Athlete
"I’ve been in this industry for 8 years and I’ve not seen a home body analyzer this accurate! I’ve recommended this to all my client"
Hume User
Brianna McNeal
Olympic Runner

Frank gore
5× Pro Bowl NFL Legend
NFL
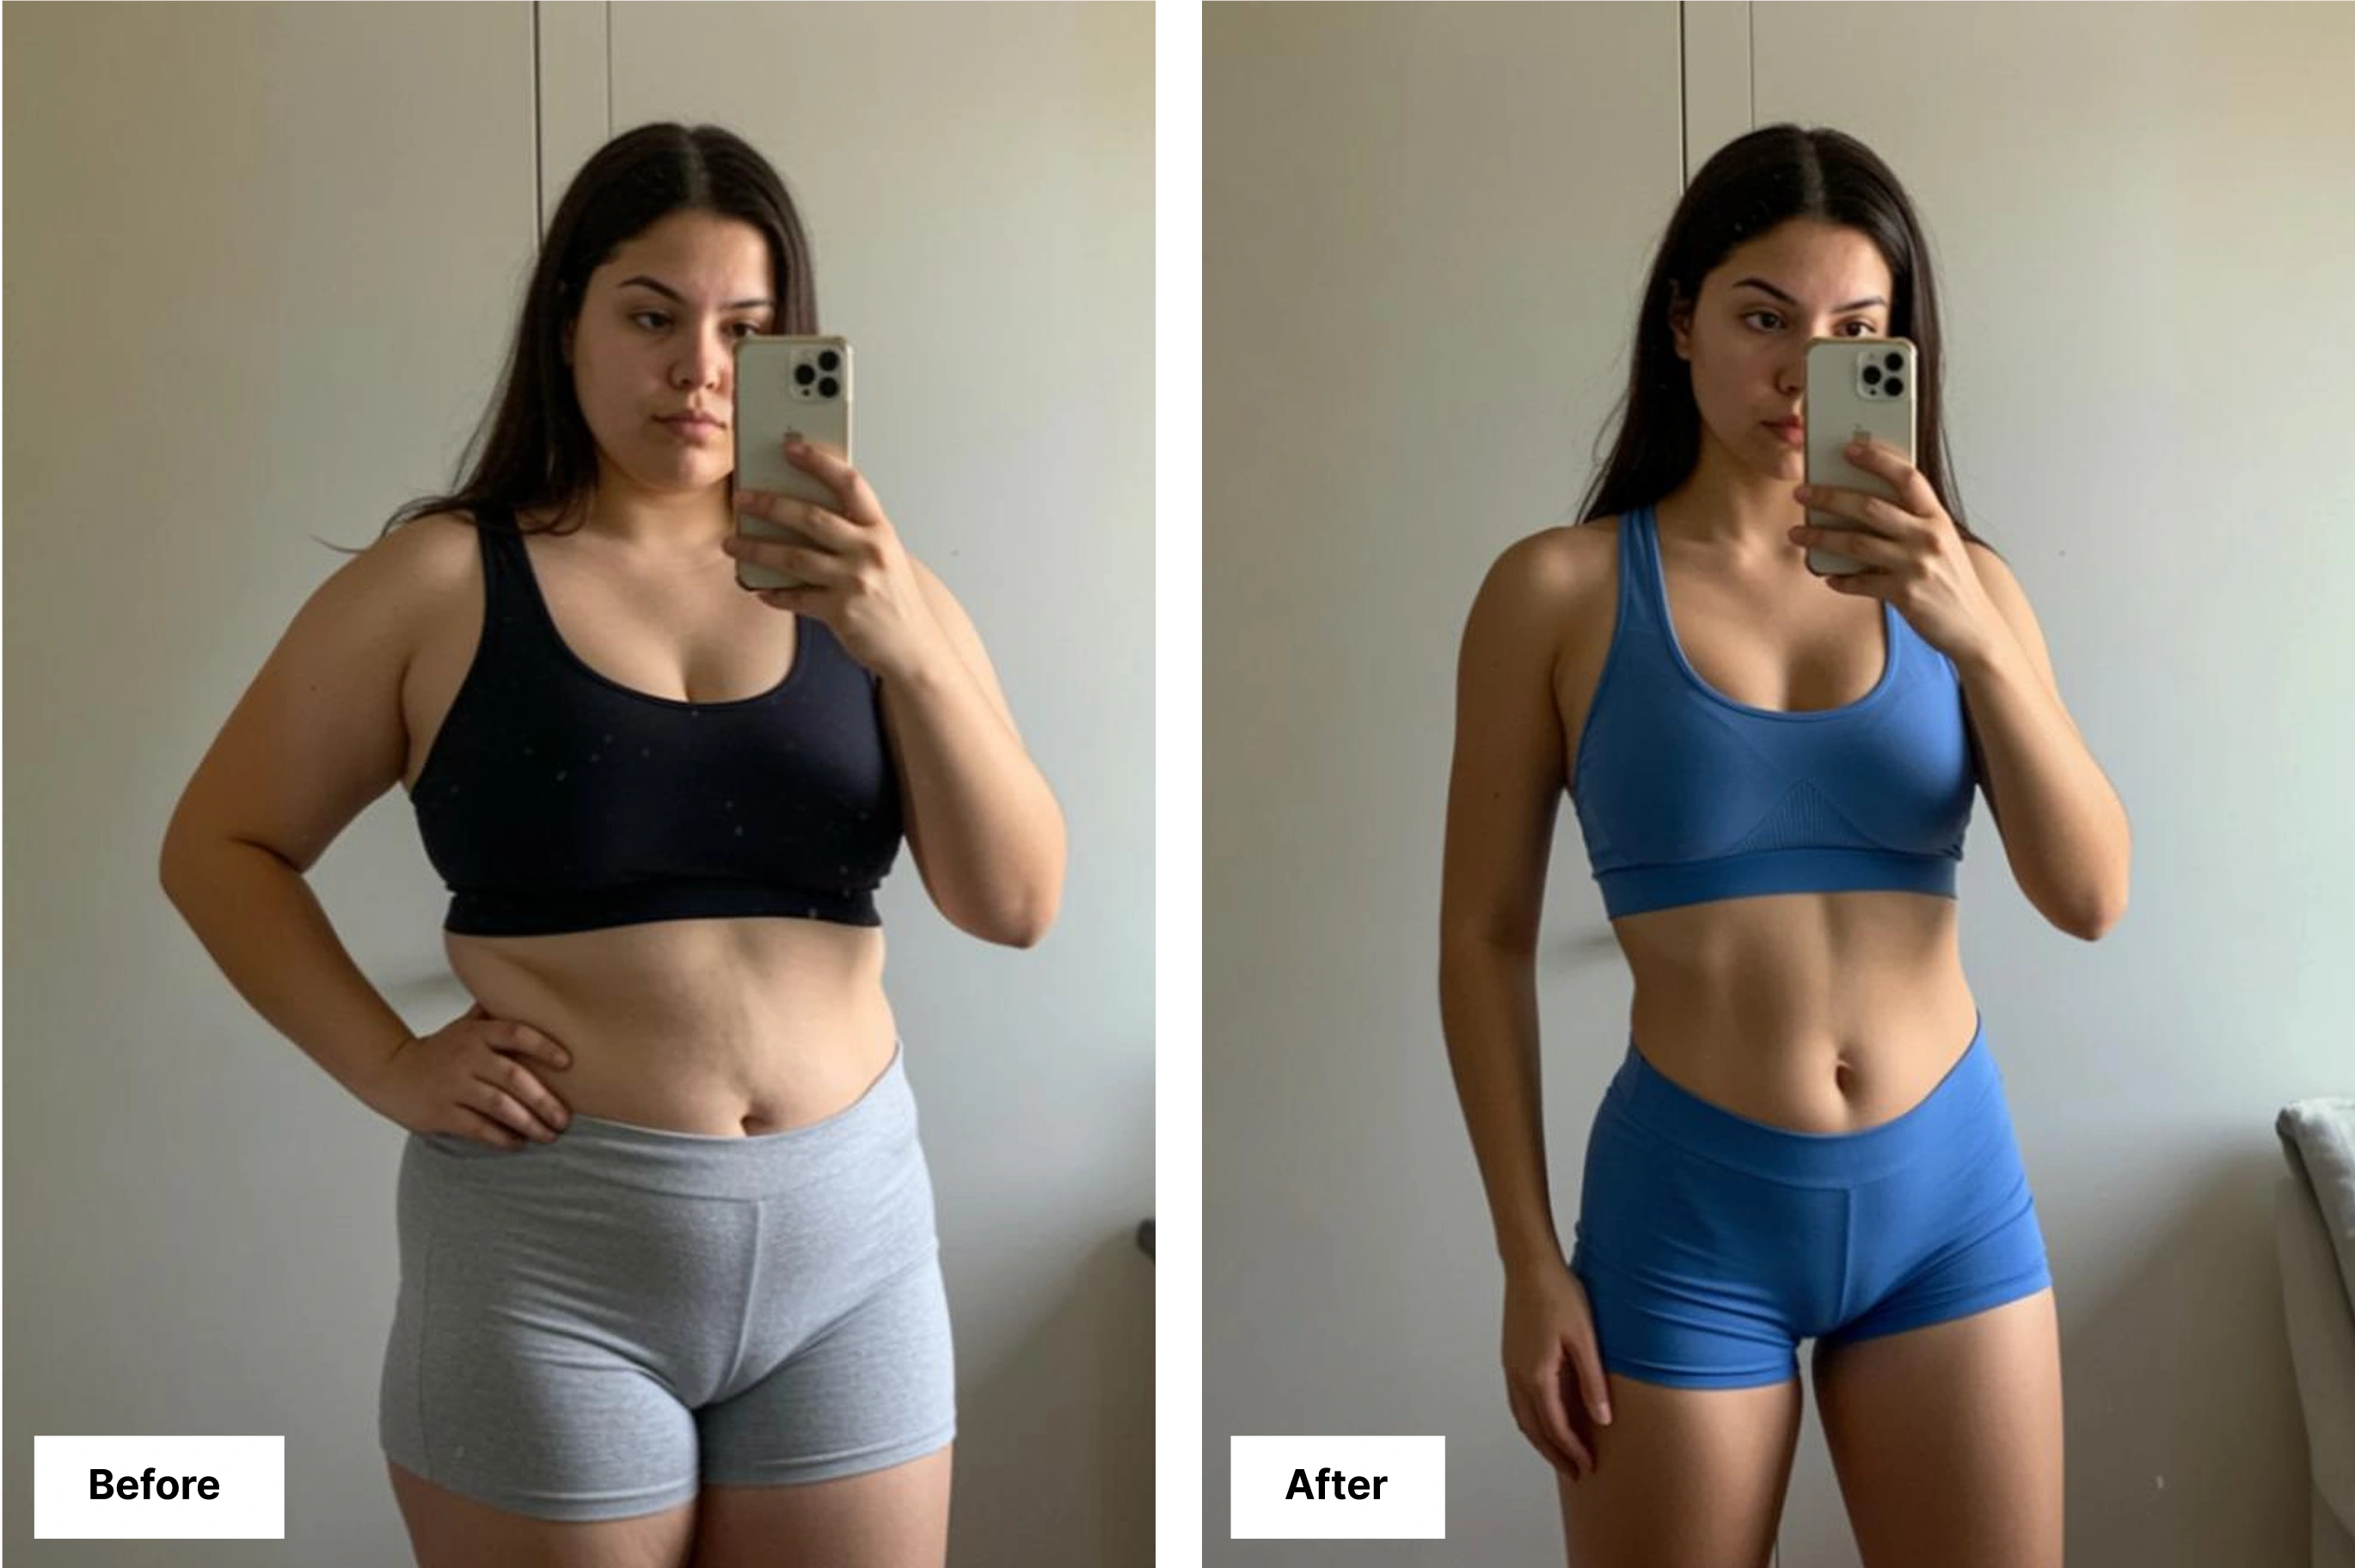
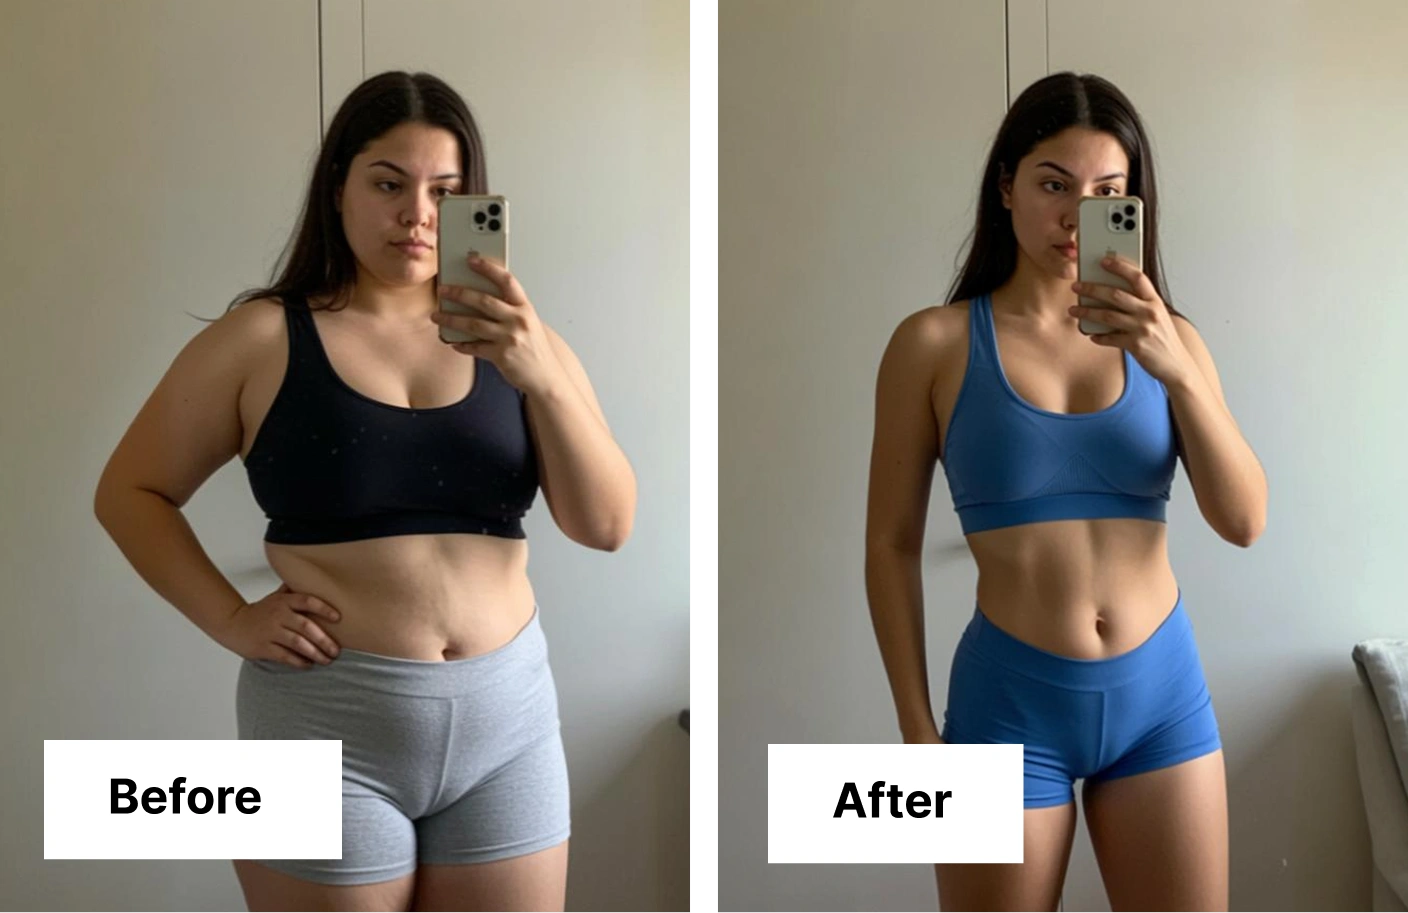
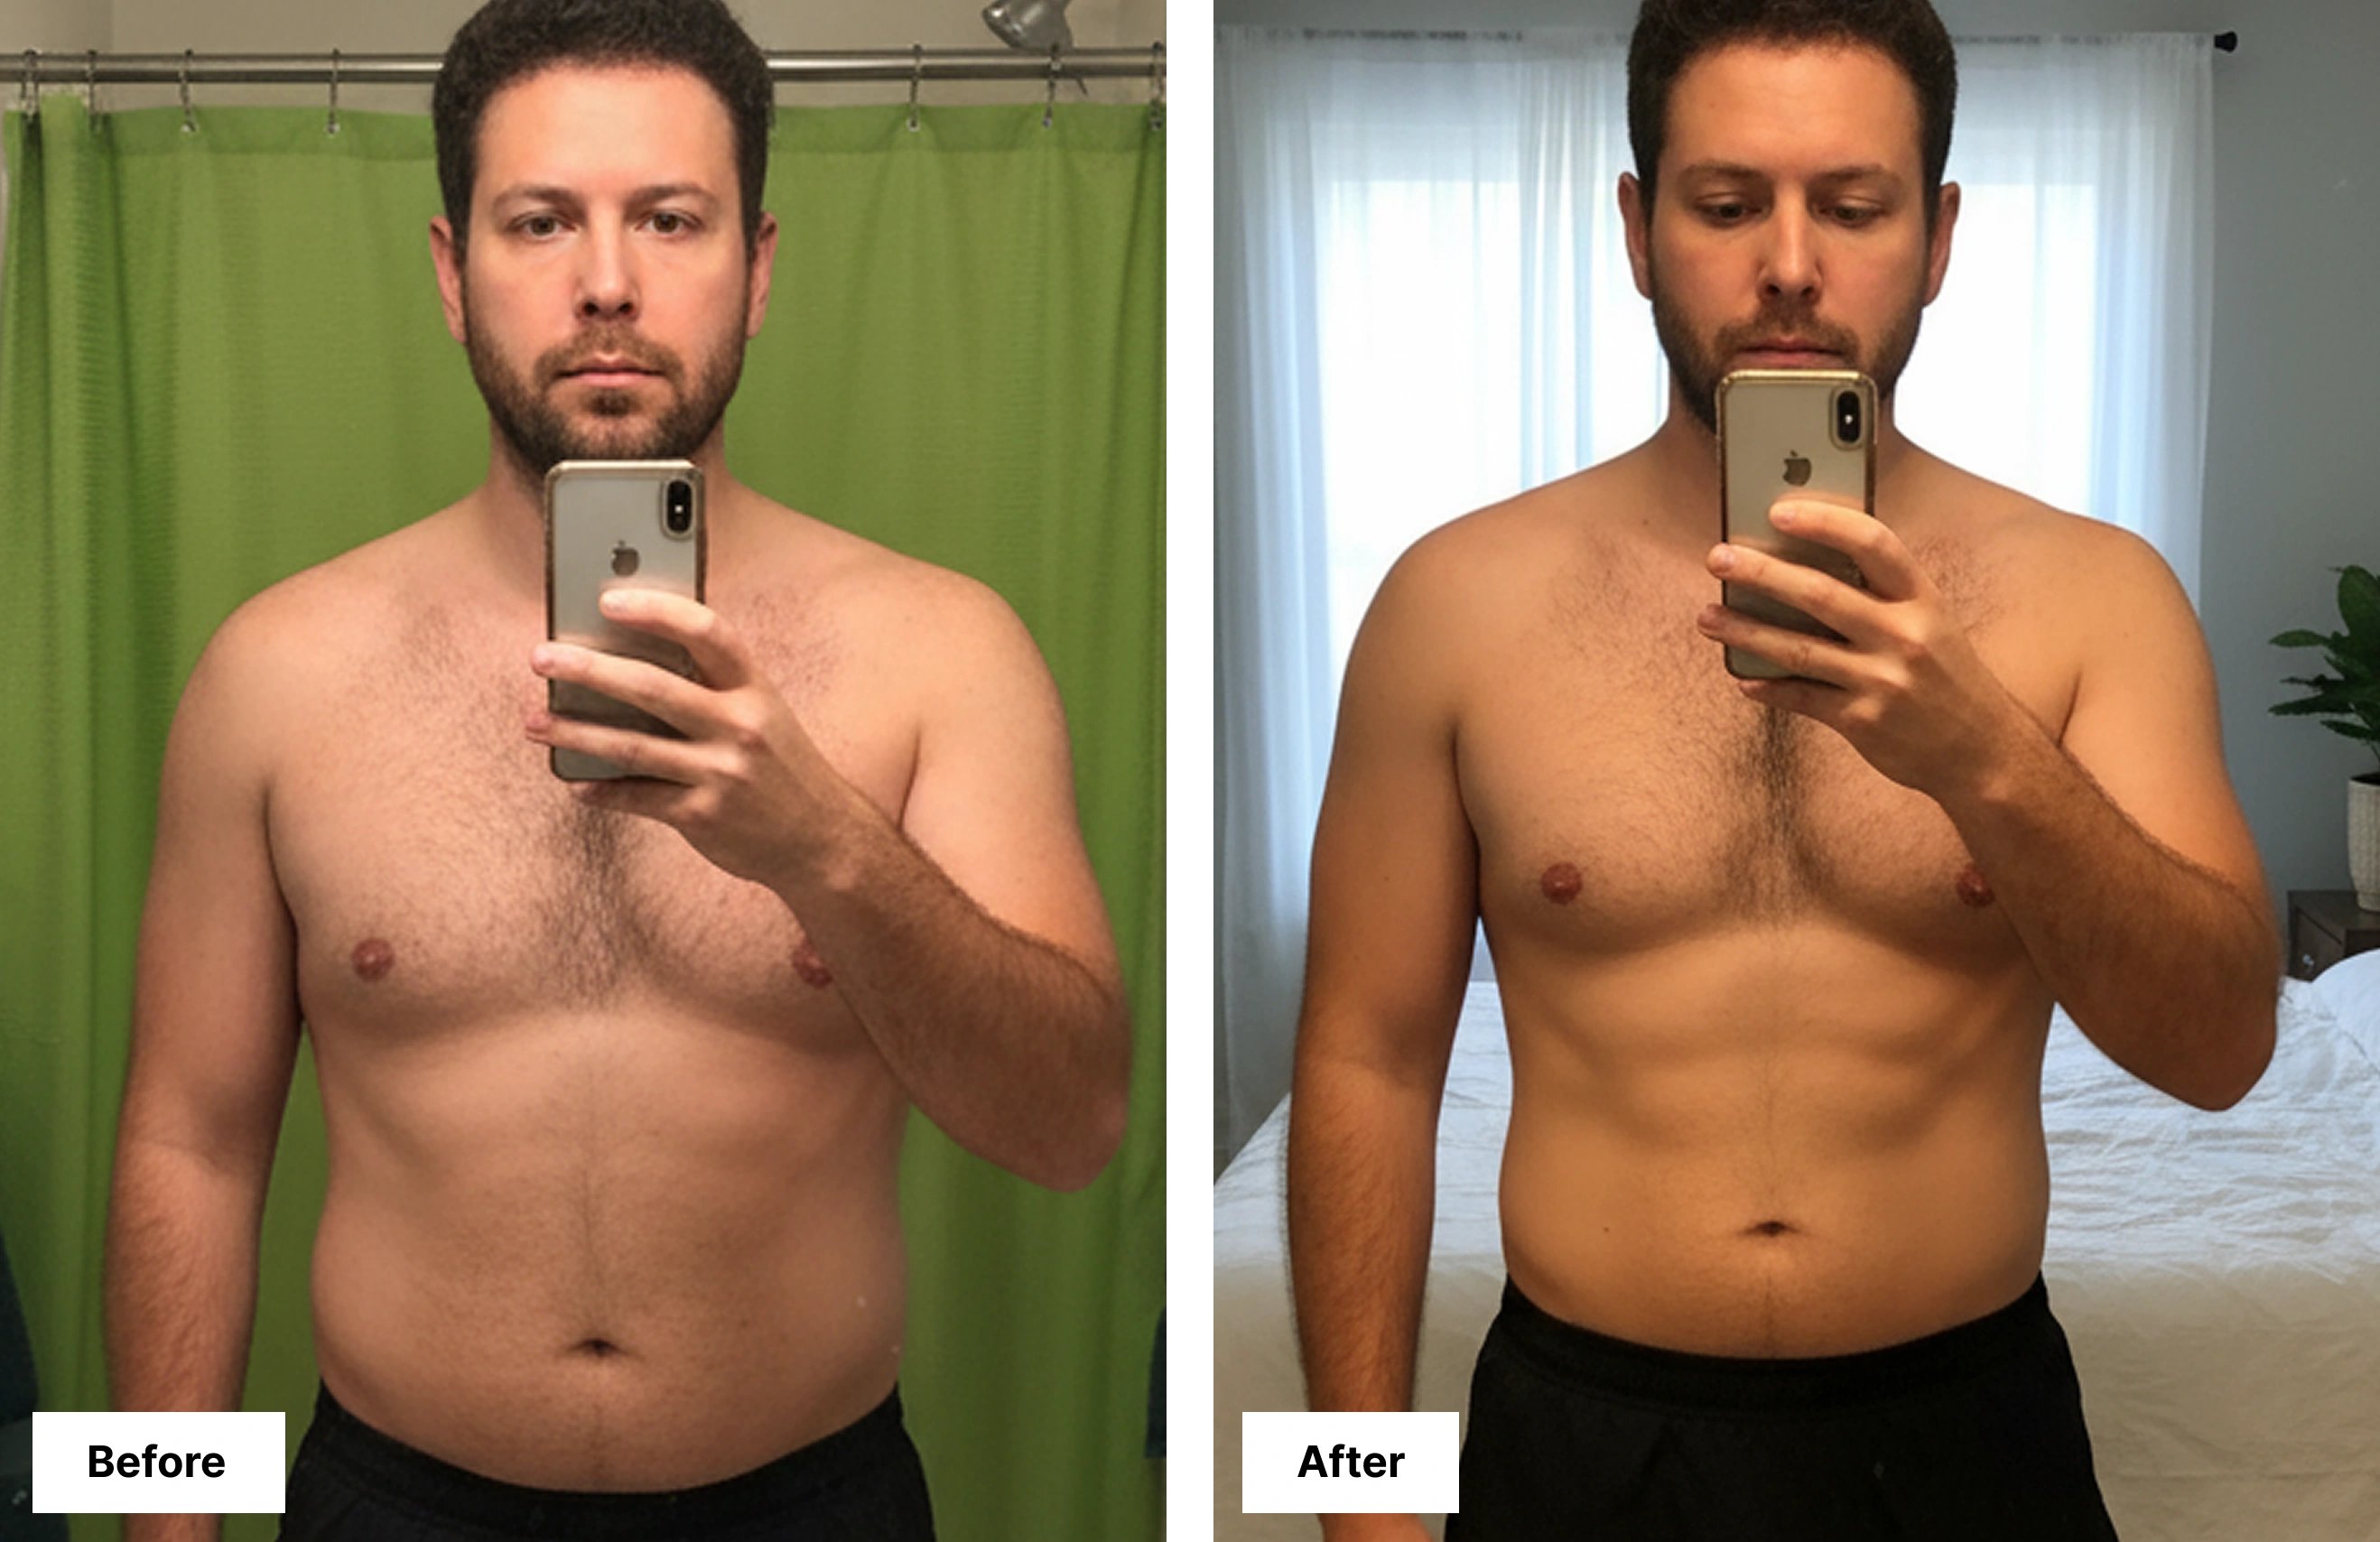
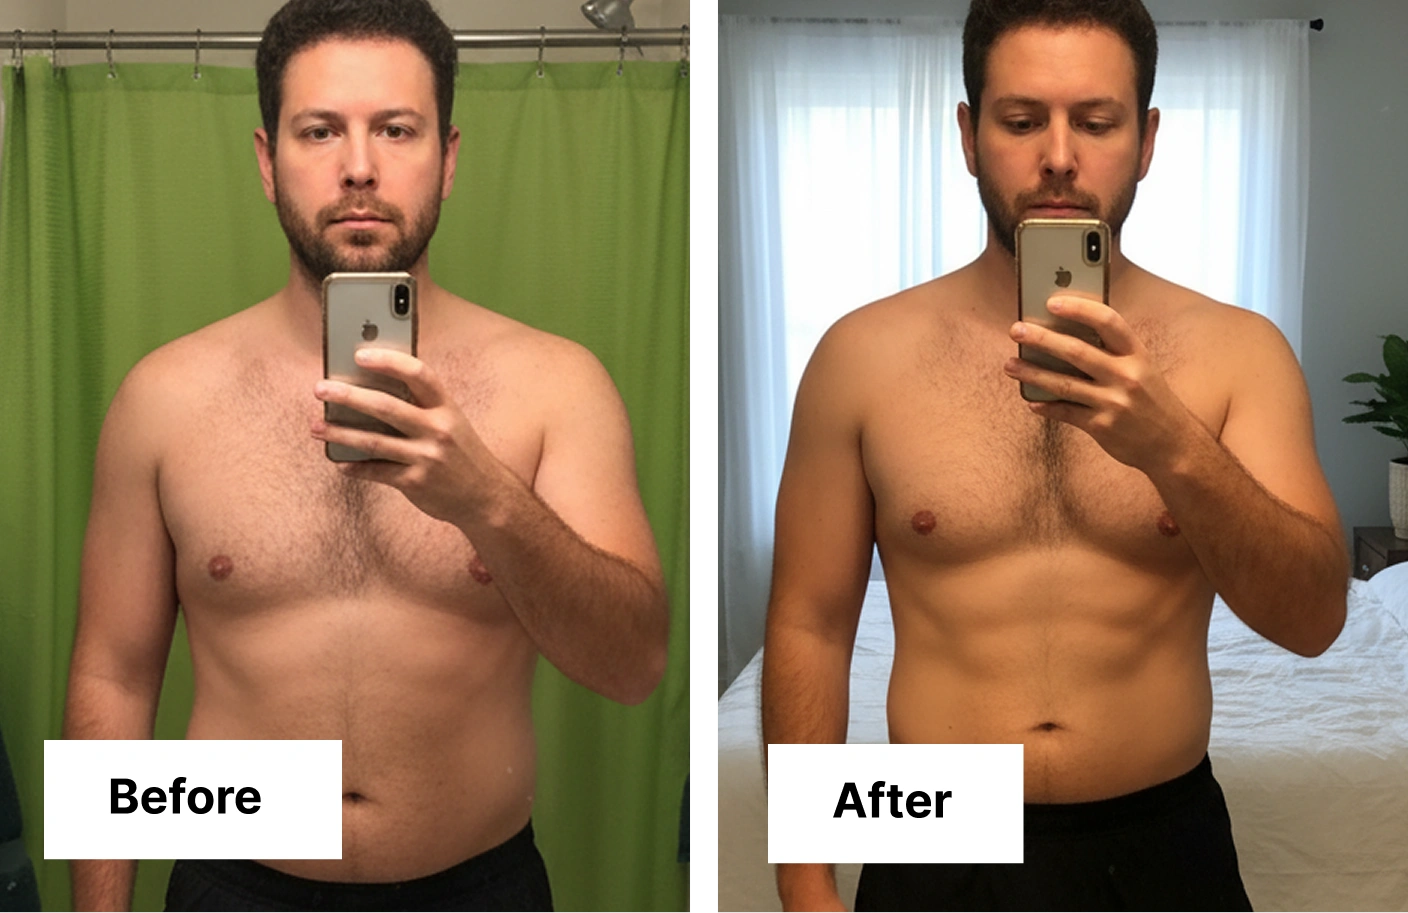
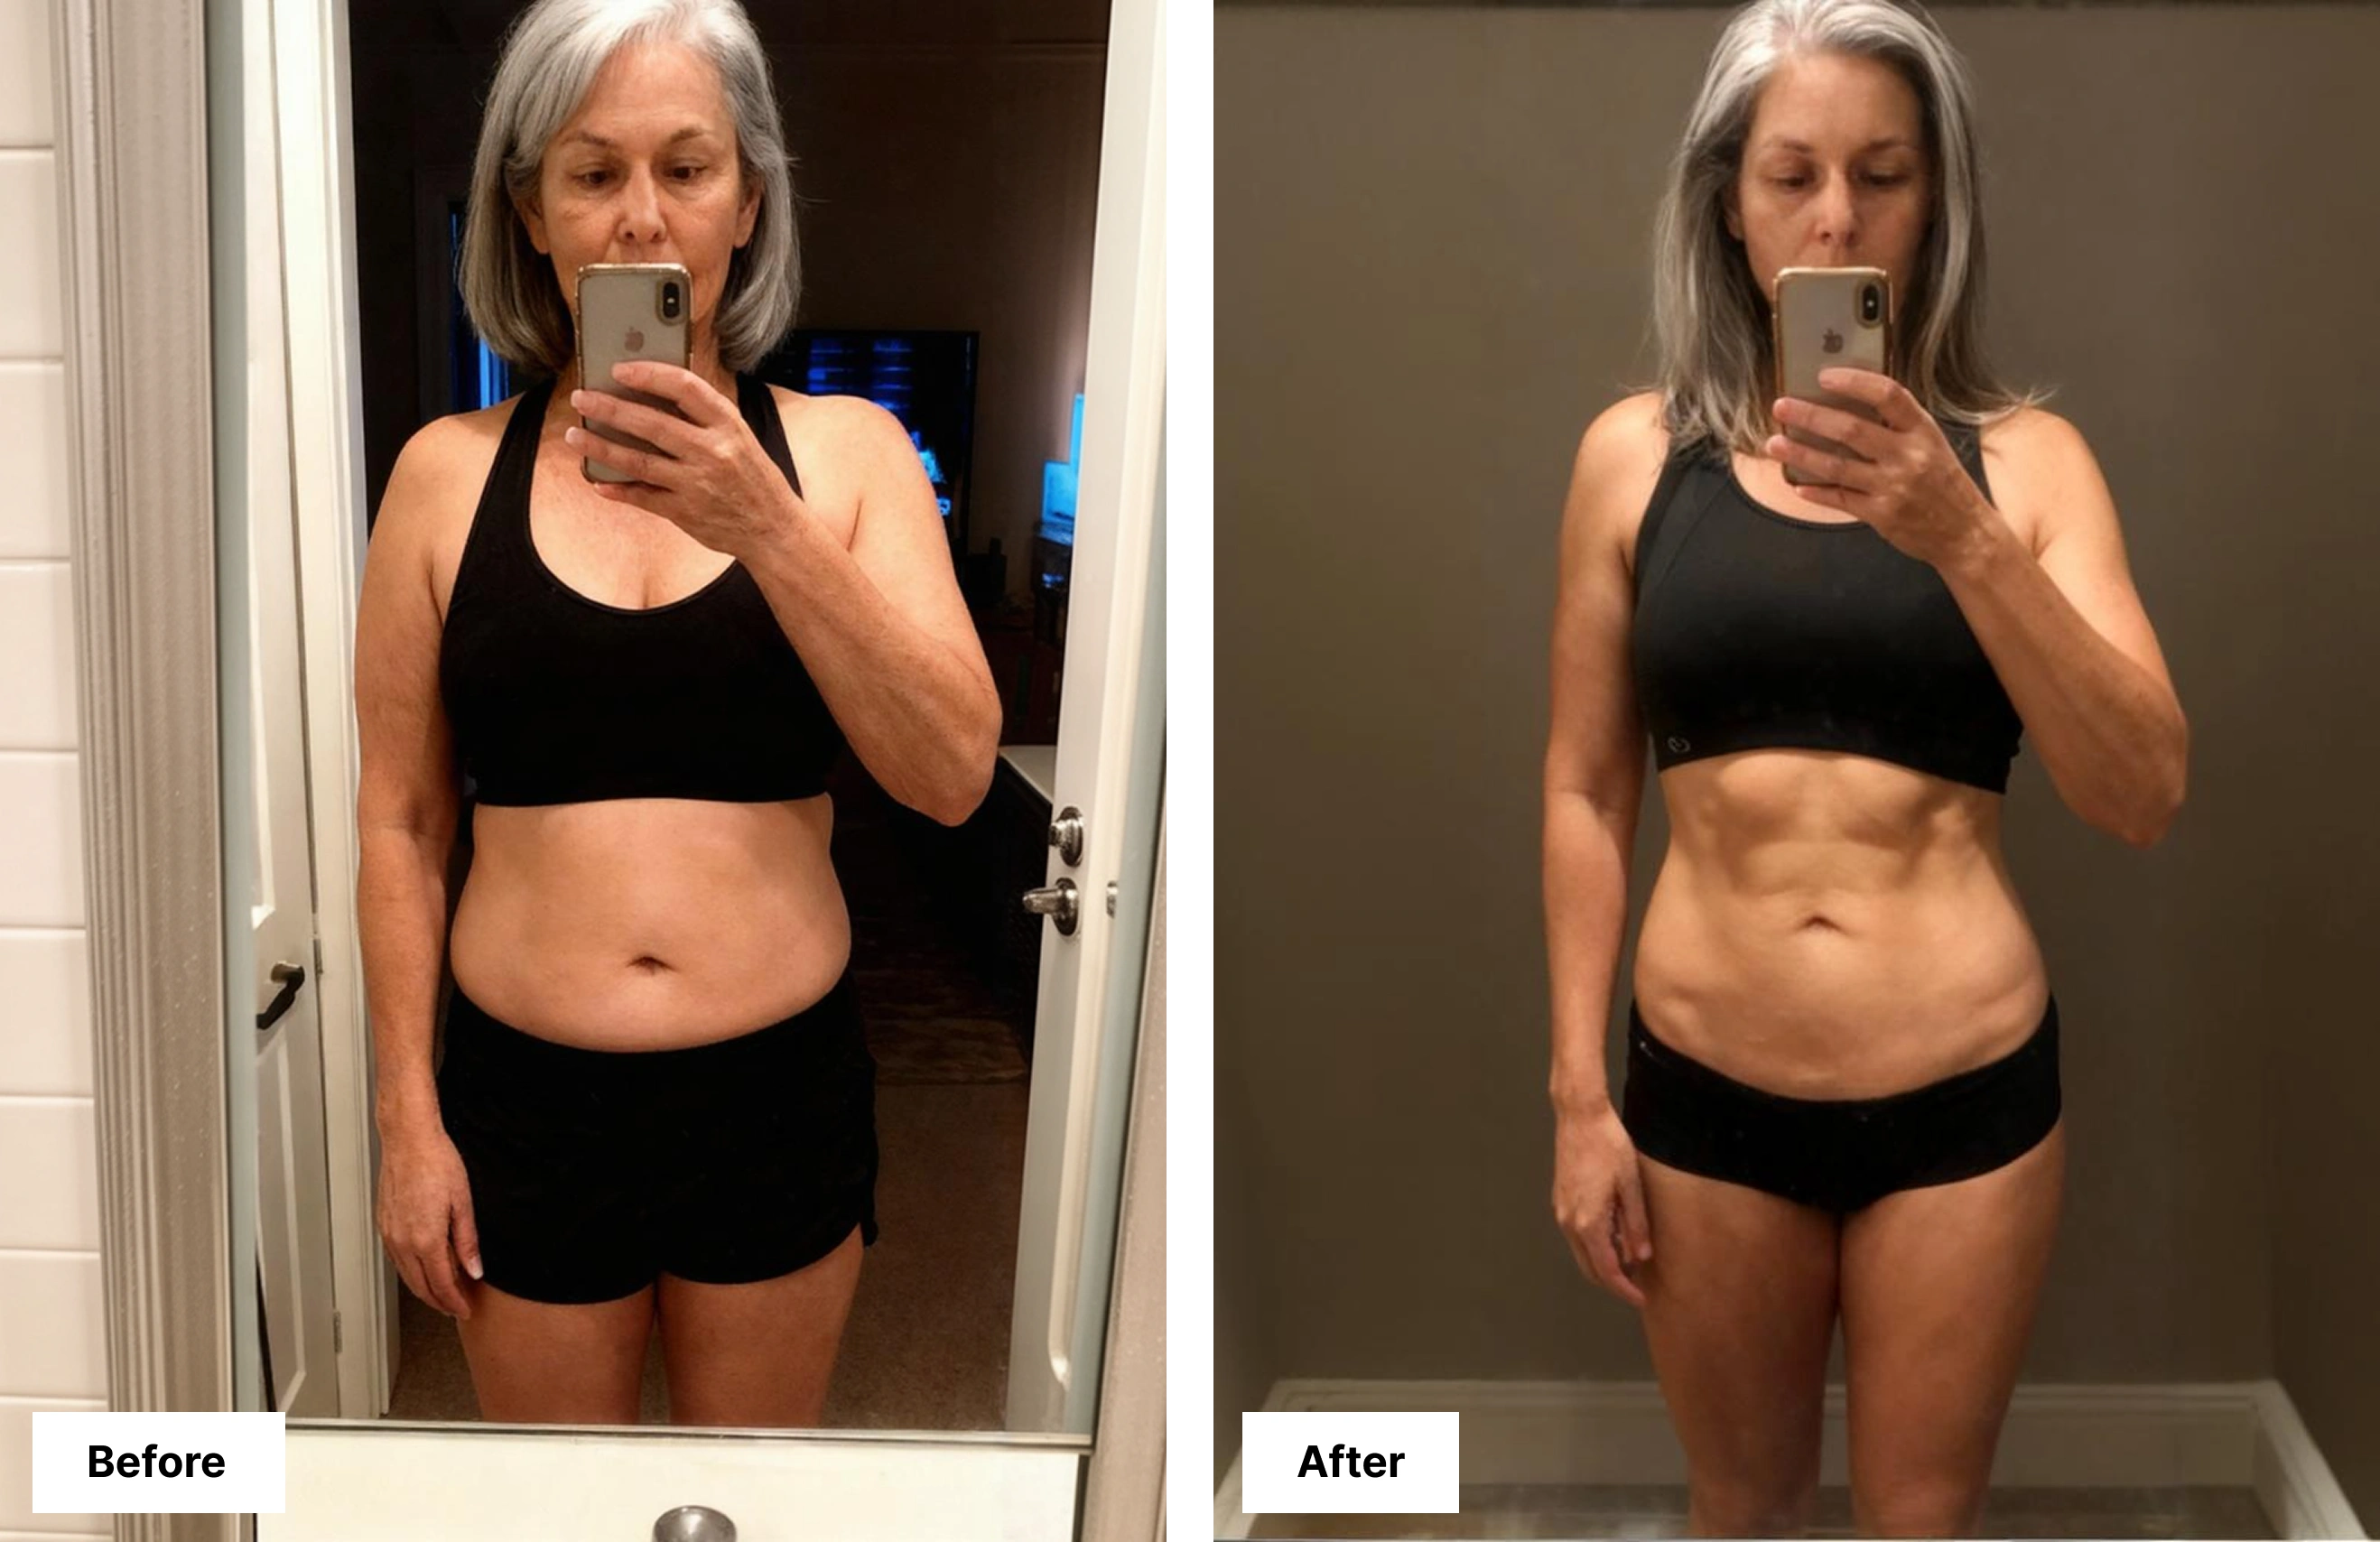

Why 100,000+ others are fans

Game changer
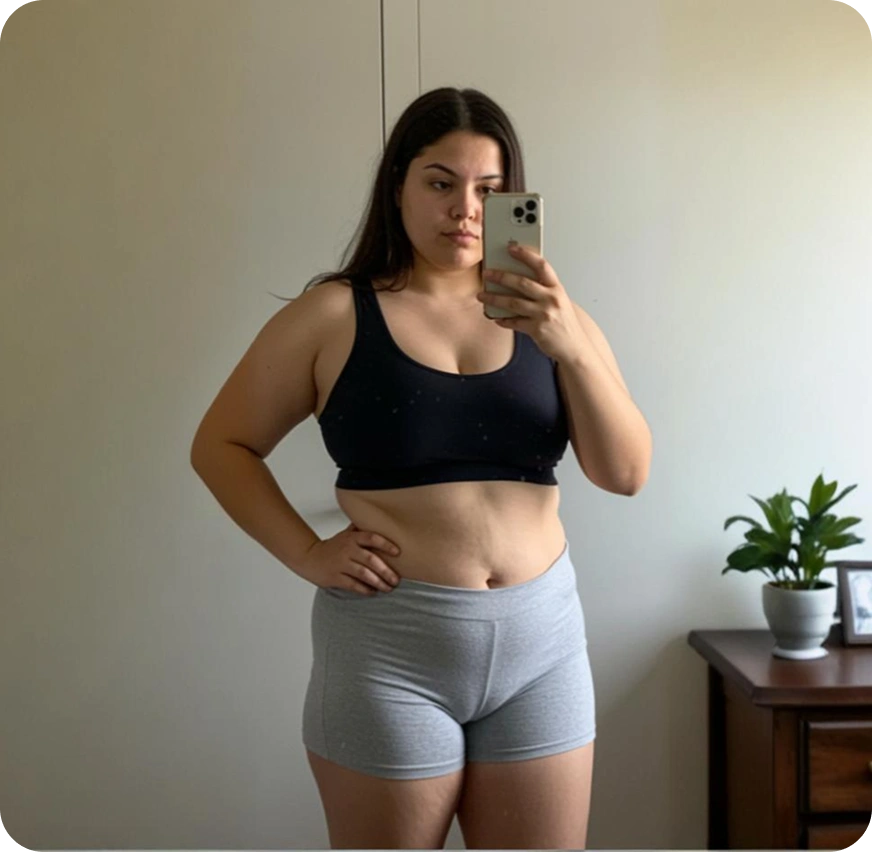
@HumePod is a game changer. I thought it was another pointless tech, until I started using it. Lost 14lbs of body fat in just 6 months!
Kickstarting
“Just started a diet program, and I can’t rave enough about this Hume Pod! It’s really made me feel supported in kickstarting my health journey”
Motivating
“I’m almost at my goal weight and couldn’t be any happier. Being able to see what’s working and what isn’t has been very motivating”
Super
“I’m down 5lbs in just 3 weeks! Tried everything but with the Hume Pod, i finally know what to work on! It’s been super eye opening!”
Fitness journey
“This was exactly what i needed to kickstart my fitness journey. Being able to understand which area I need to work on, has kept me very motivated”
Why 1,000,000+ others are fans
 Month 1
 Month 6
Motivating
“I’m almost at my goal weight and couldn’t be any happier. Being able to see what’s working and what isn’t has been very motivating”
 Month 1
 Month 8
Game changer
@HumePod is a game changer. I thought it was another pointless tech, until I started using it. Lost 14lbs of body fat in just 6 months!
 Month 1
 Month 6
Super
“I’m down 5lbs in just 3 weeks! Tried everything but with the Hume Pod, i finally know what to work on! It’s been super eye opening!”
 Month 1
 Month 6
Kickstarting
“Just started a diet program, and I can’t rave enough about this Hume Pod! It’s really made me feel supported in kickstarting my health journey”
#1 choice for professionals all across the world






Focus on health
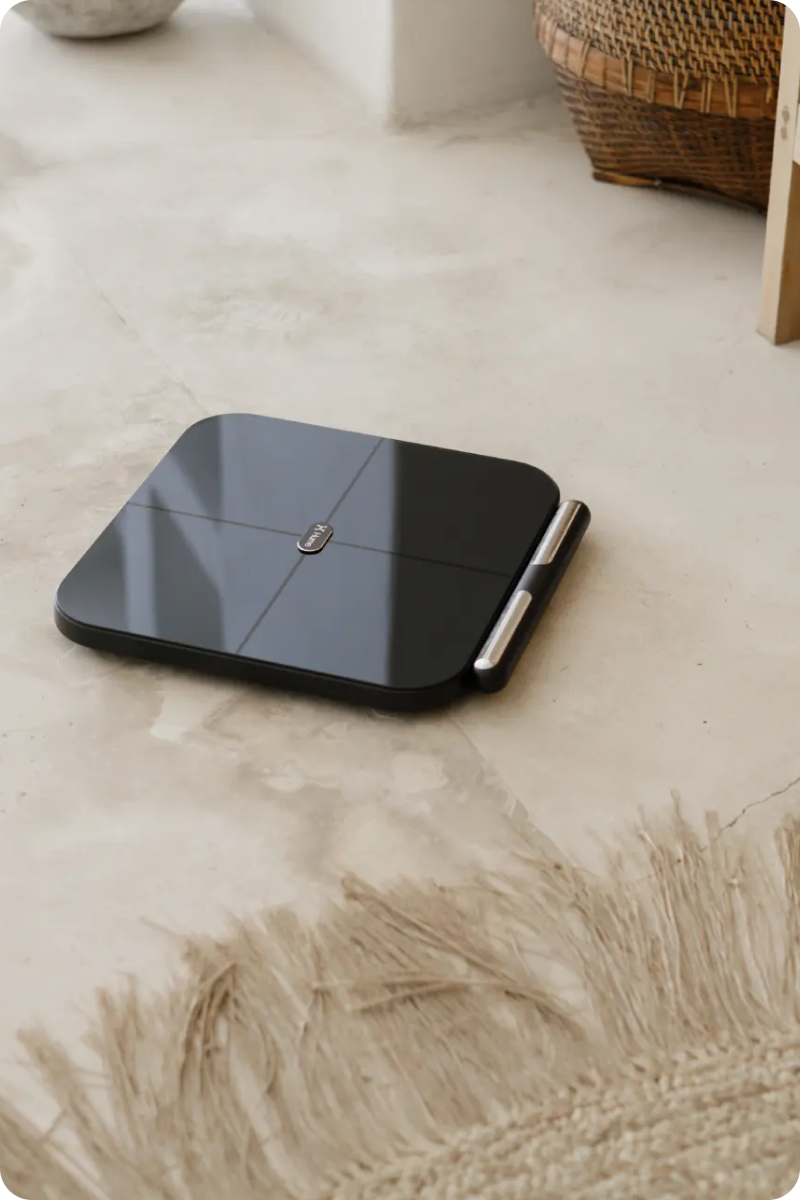
Lose the right kind of weight
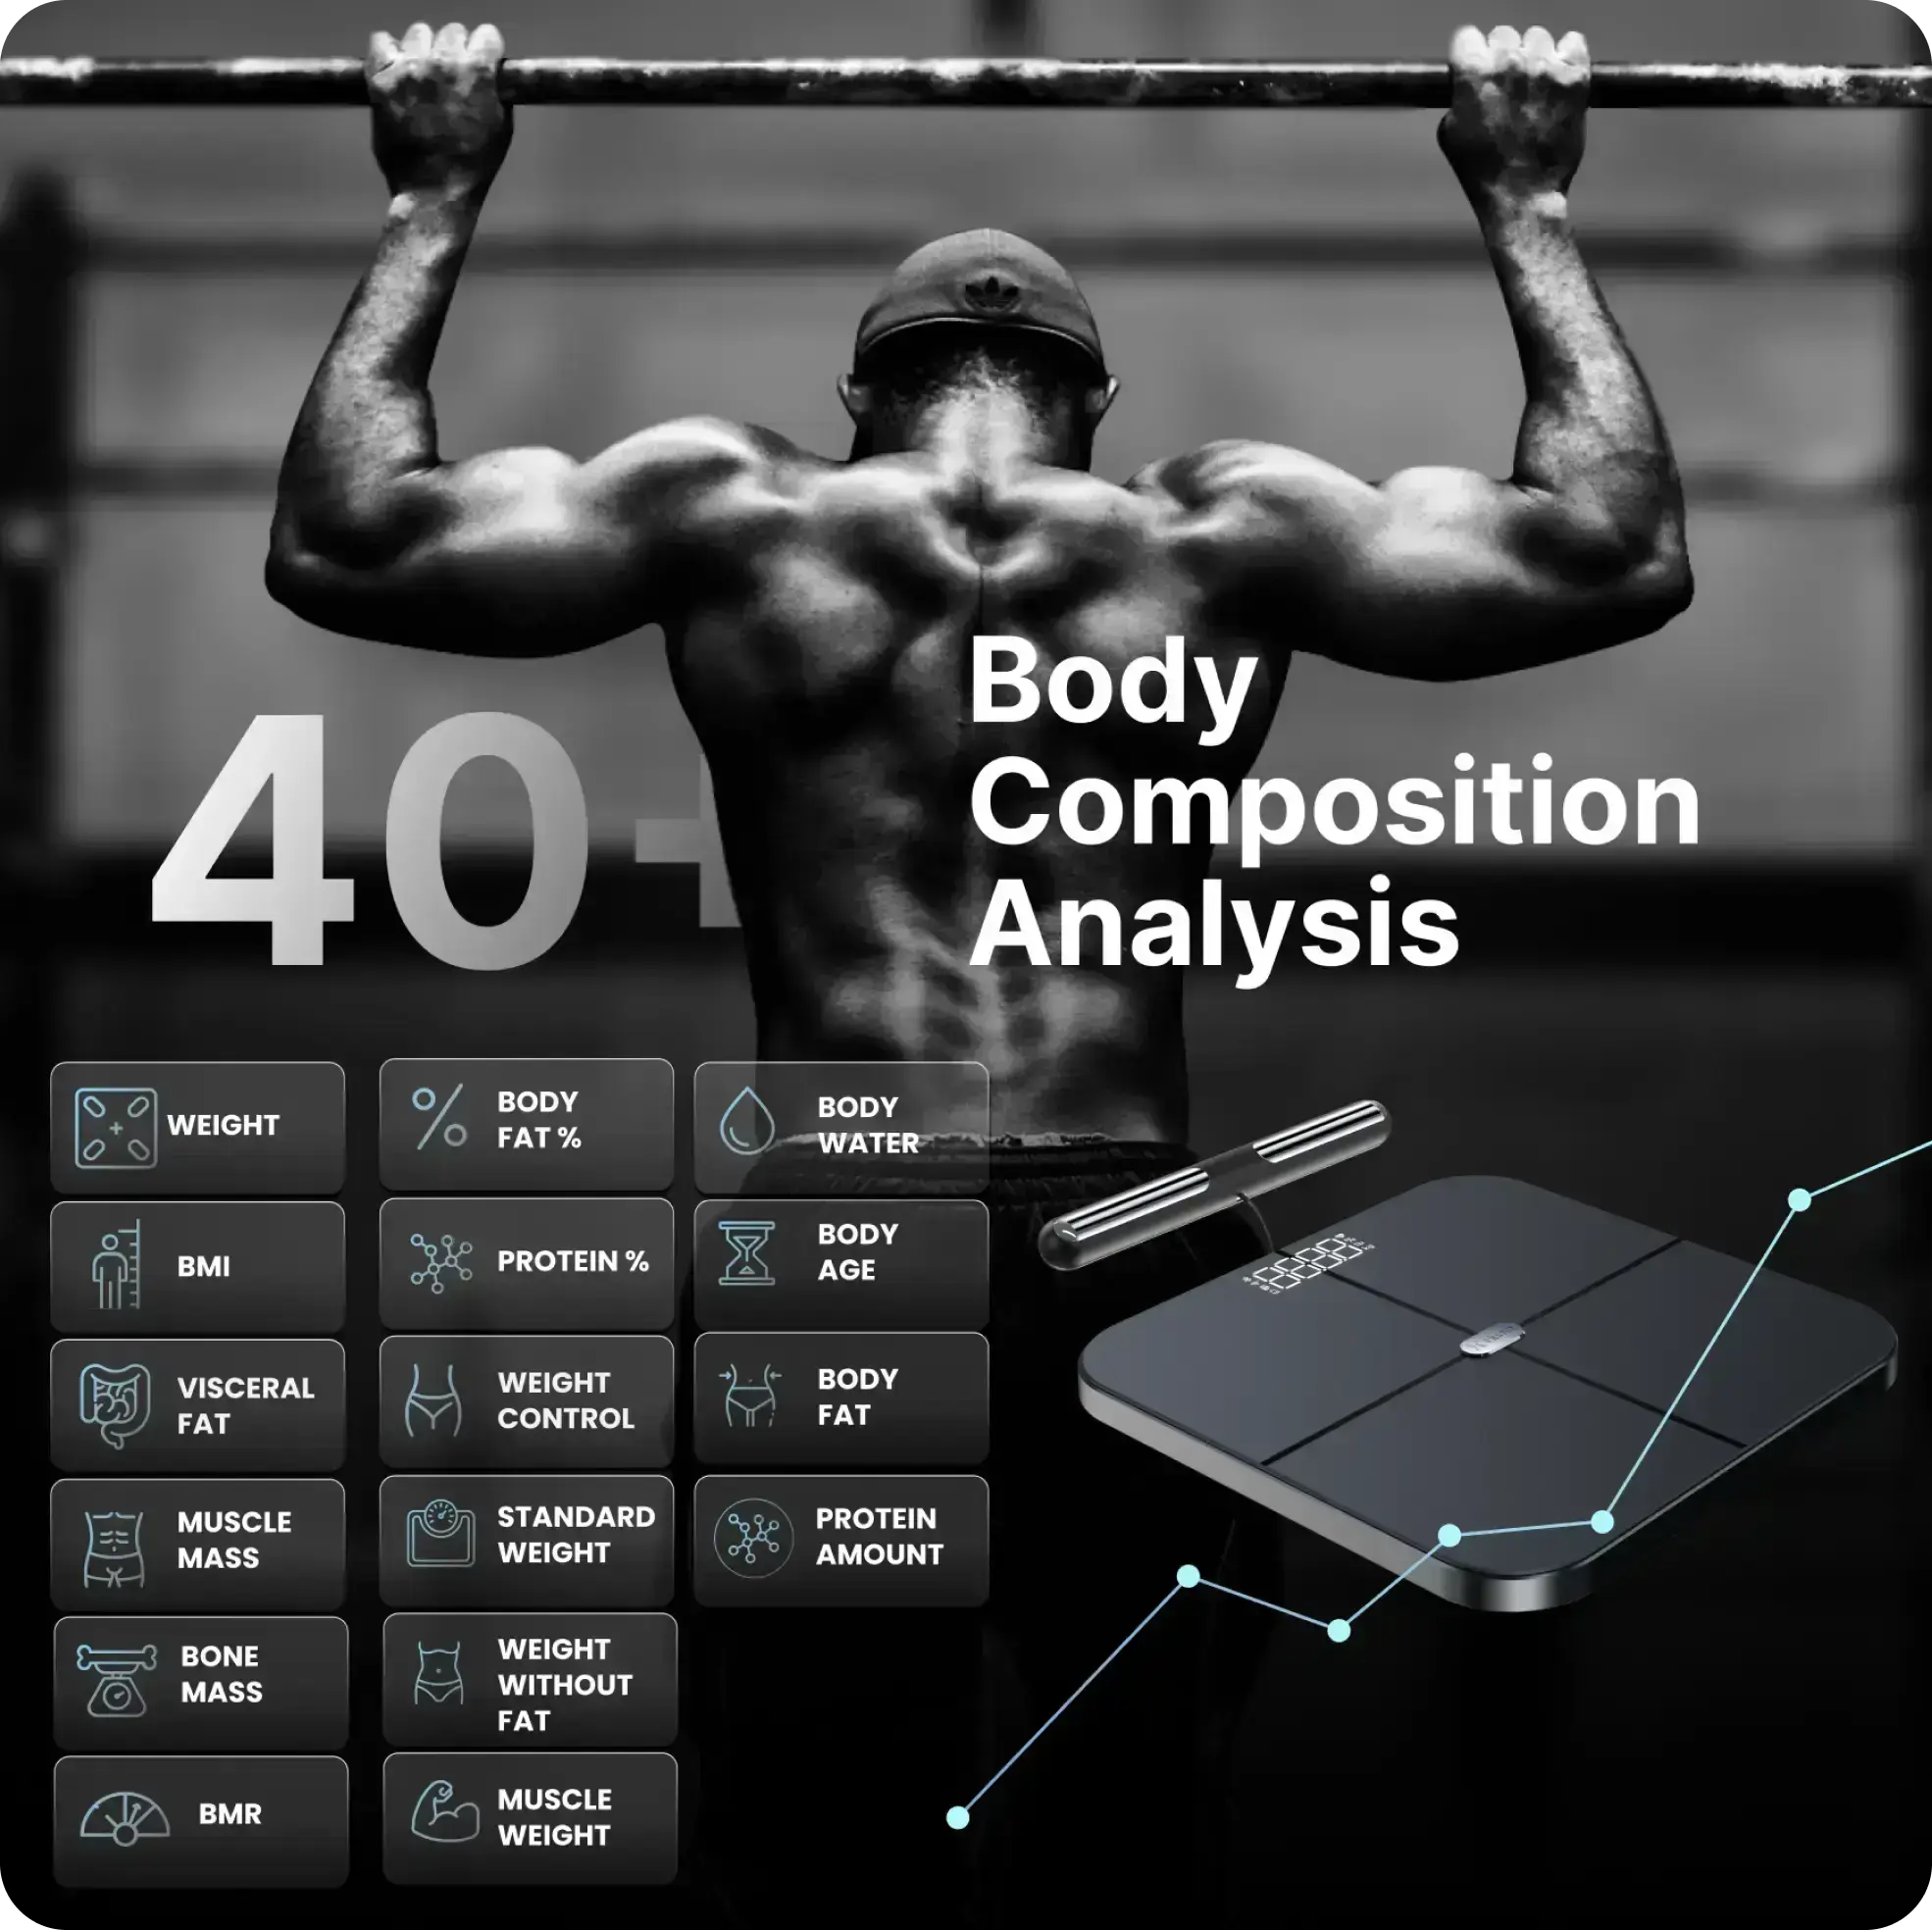
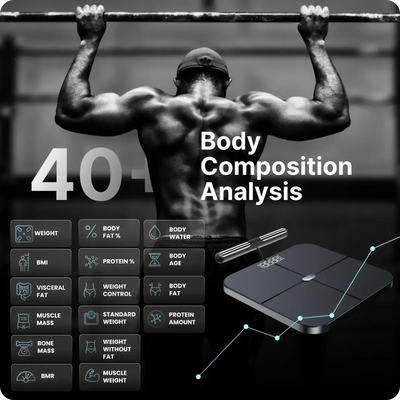
Designed to help you lose fat and gain muscle, the Hume Pod gives you the data you need to push further and see real result. Track over 45 body metrics with unmatched accuracy and gain clear insights to achieve your fitness goals.
Focus on health
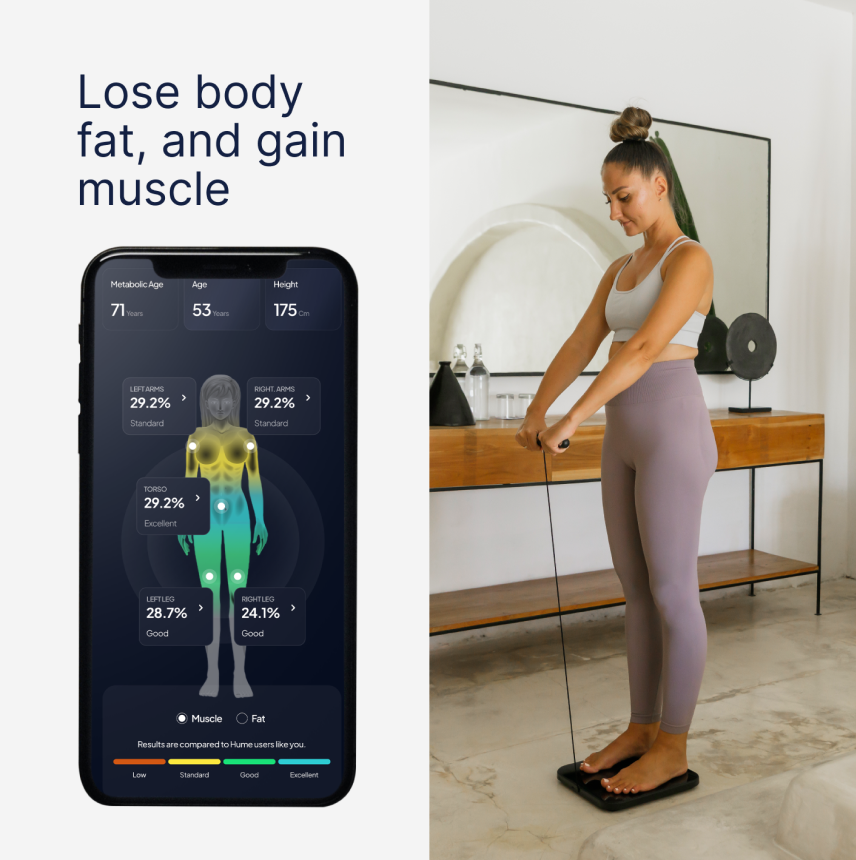
Full Body Analysis for Deeper Insights
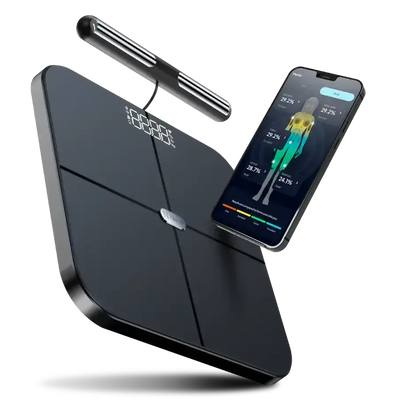
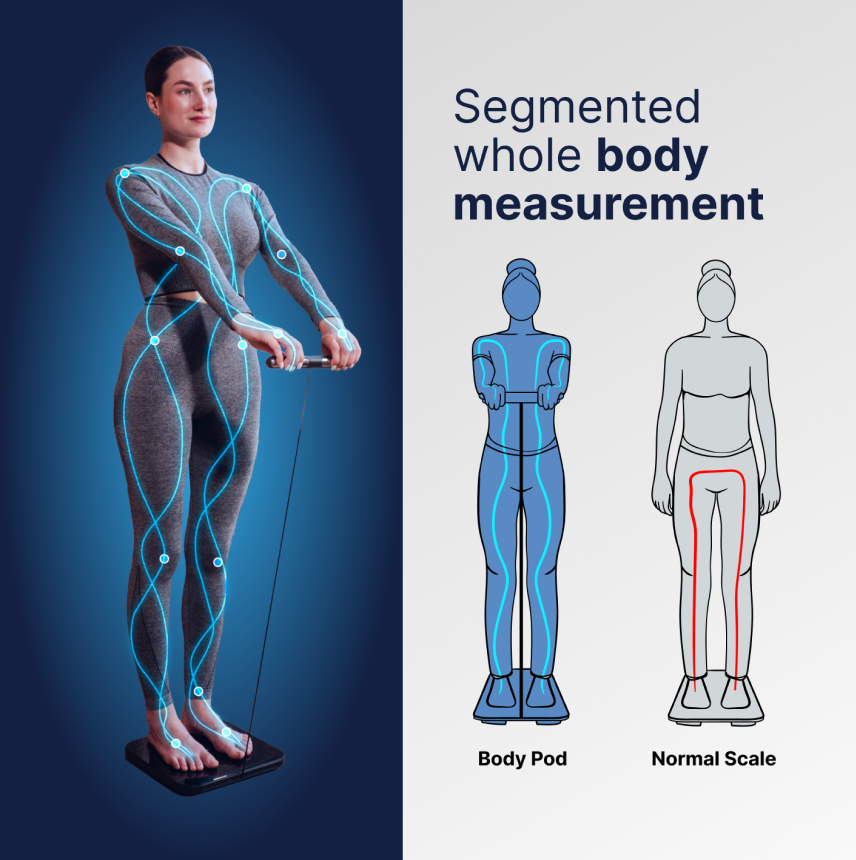
The Hume Pod uses advanced multifrequency bioelectrical impedance analysis (BIA) technology for ultra-precise assessments of each body part. Visualize fat and muscle mass like never before! This cutting-edge tech is perfect for anyone aiming to enhance their physical performance with a targeted approach.
Results you can trust
Patented BIA Technology
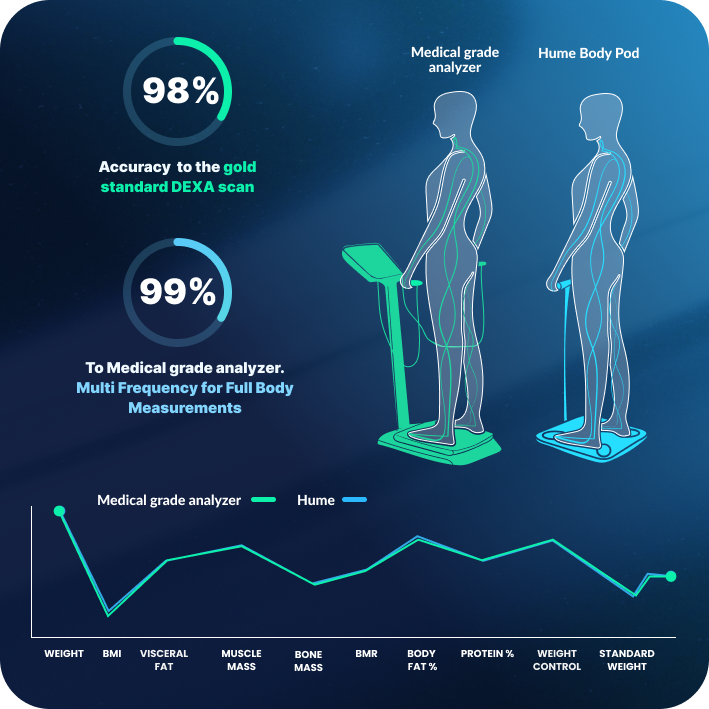
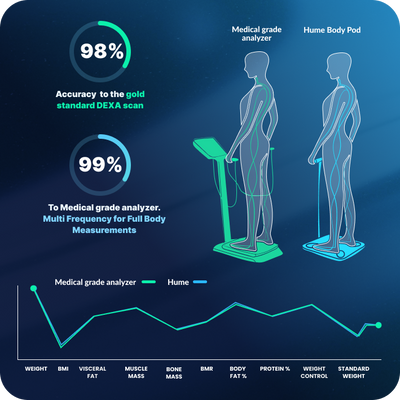
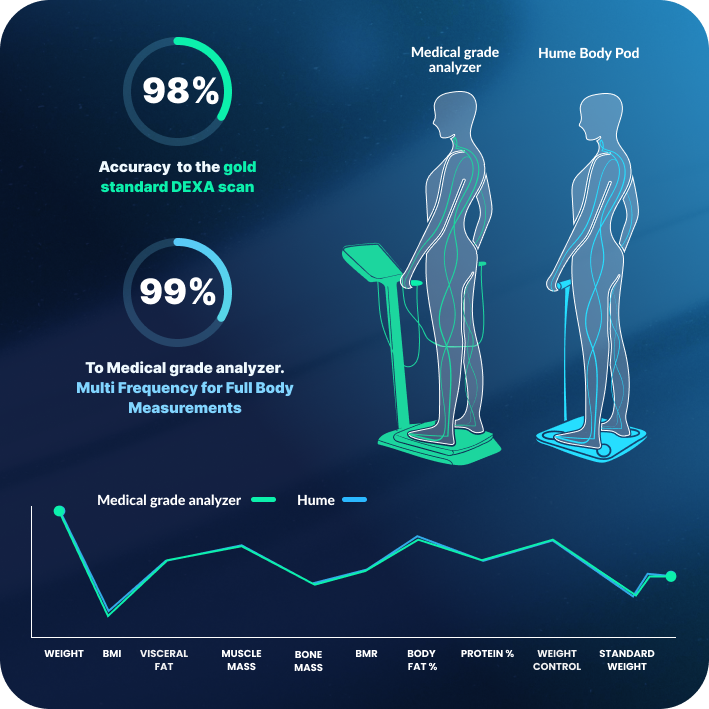
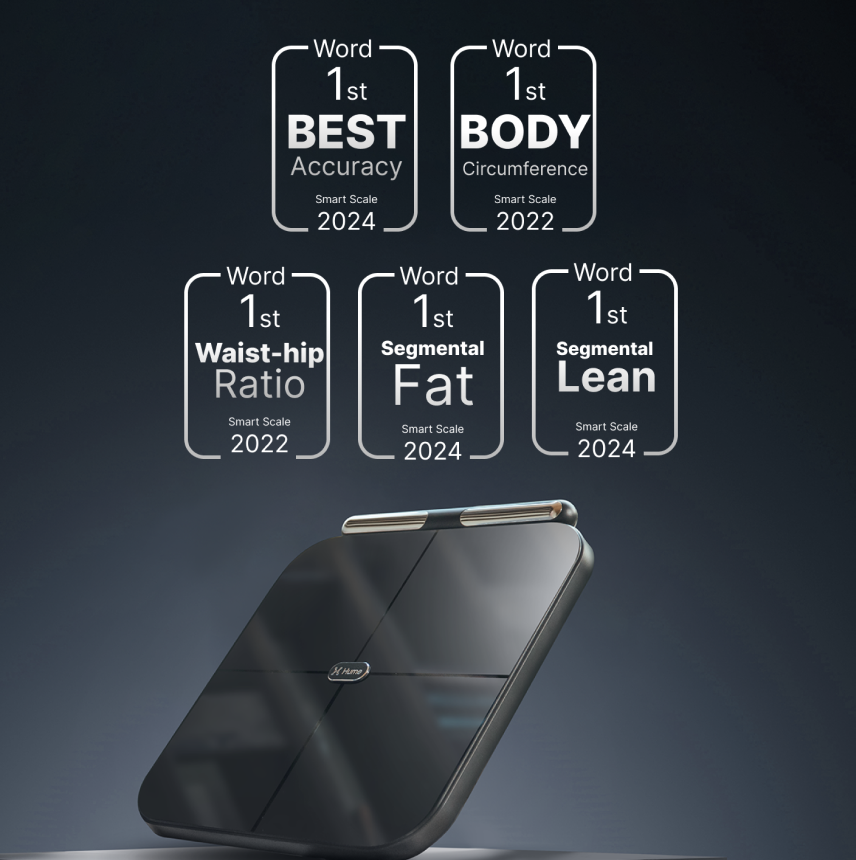
With 98% accuracy validated by third-party experts, Hume Pod is the world’s most accurate smart scale. Backed by cutting-edge technology, every reading is reliable, helping you track muscle growth or fat loss with total confidence. See studies here
Results you can trust
It Keeps You Motivated and On Track To Your Goals
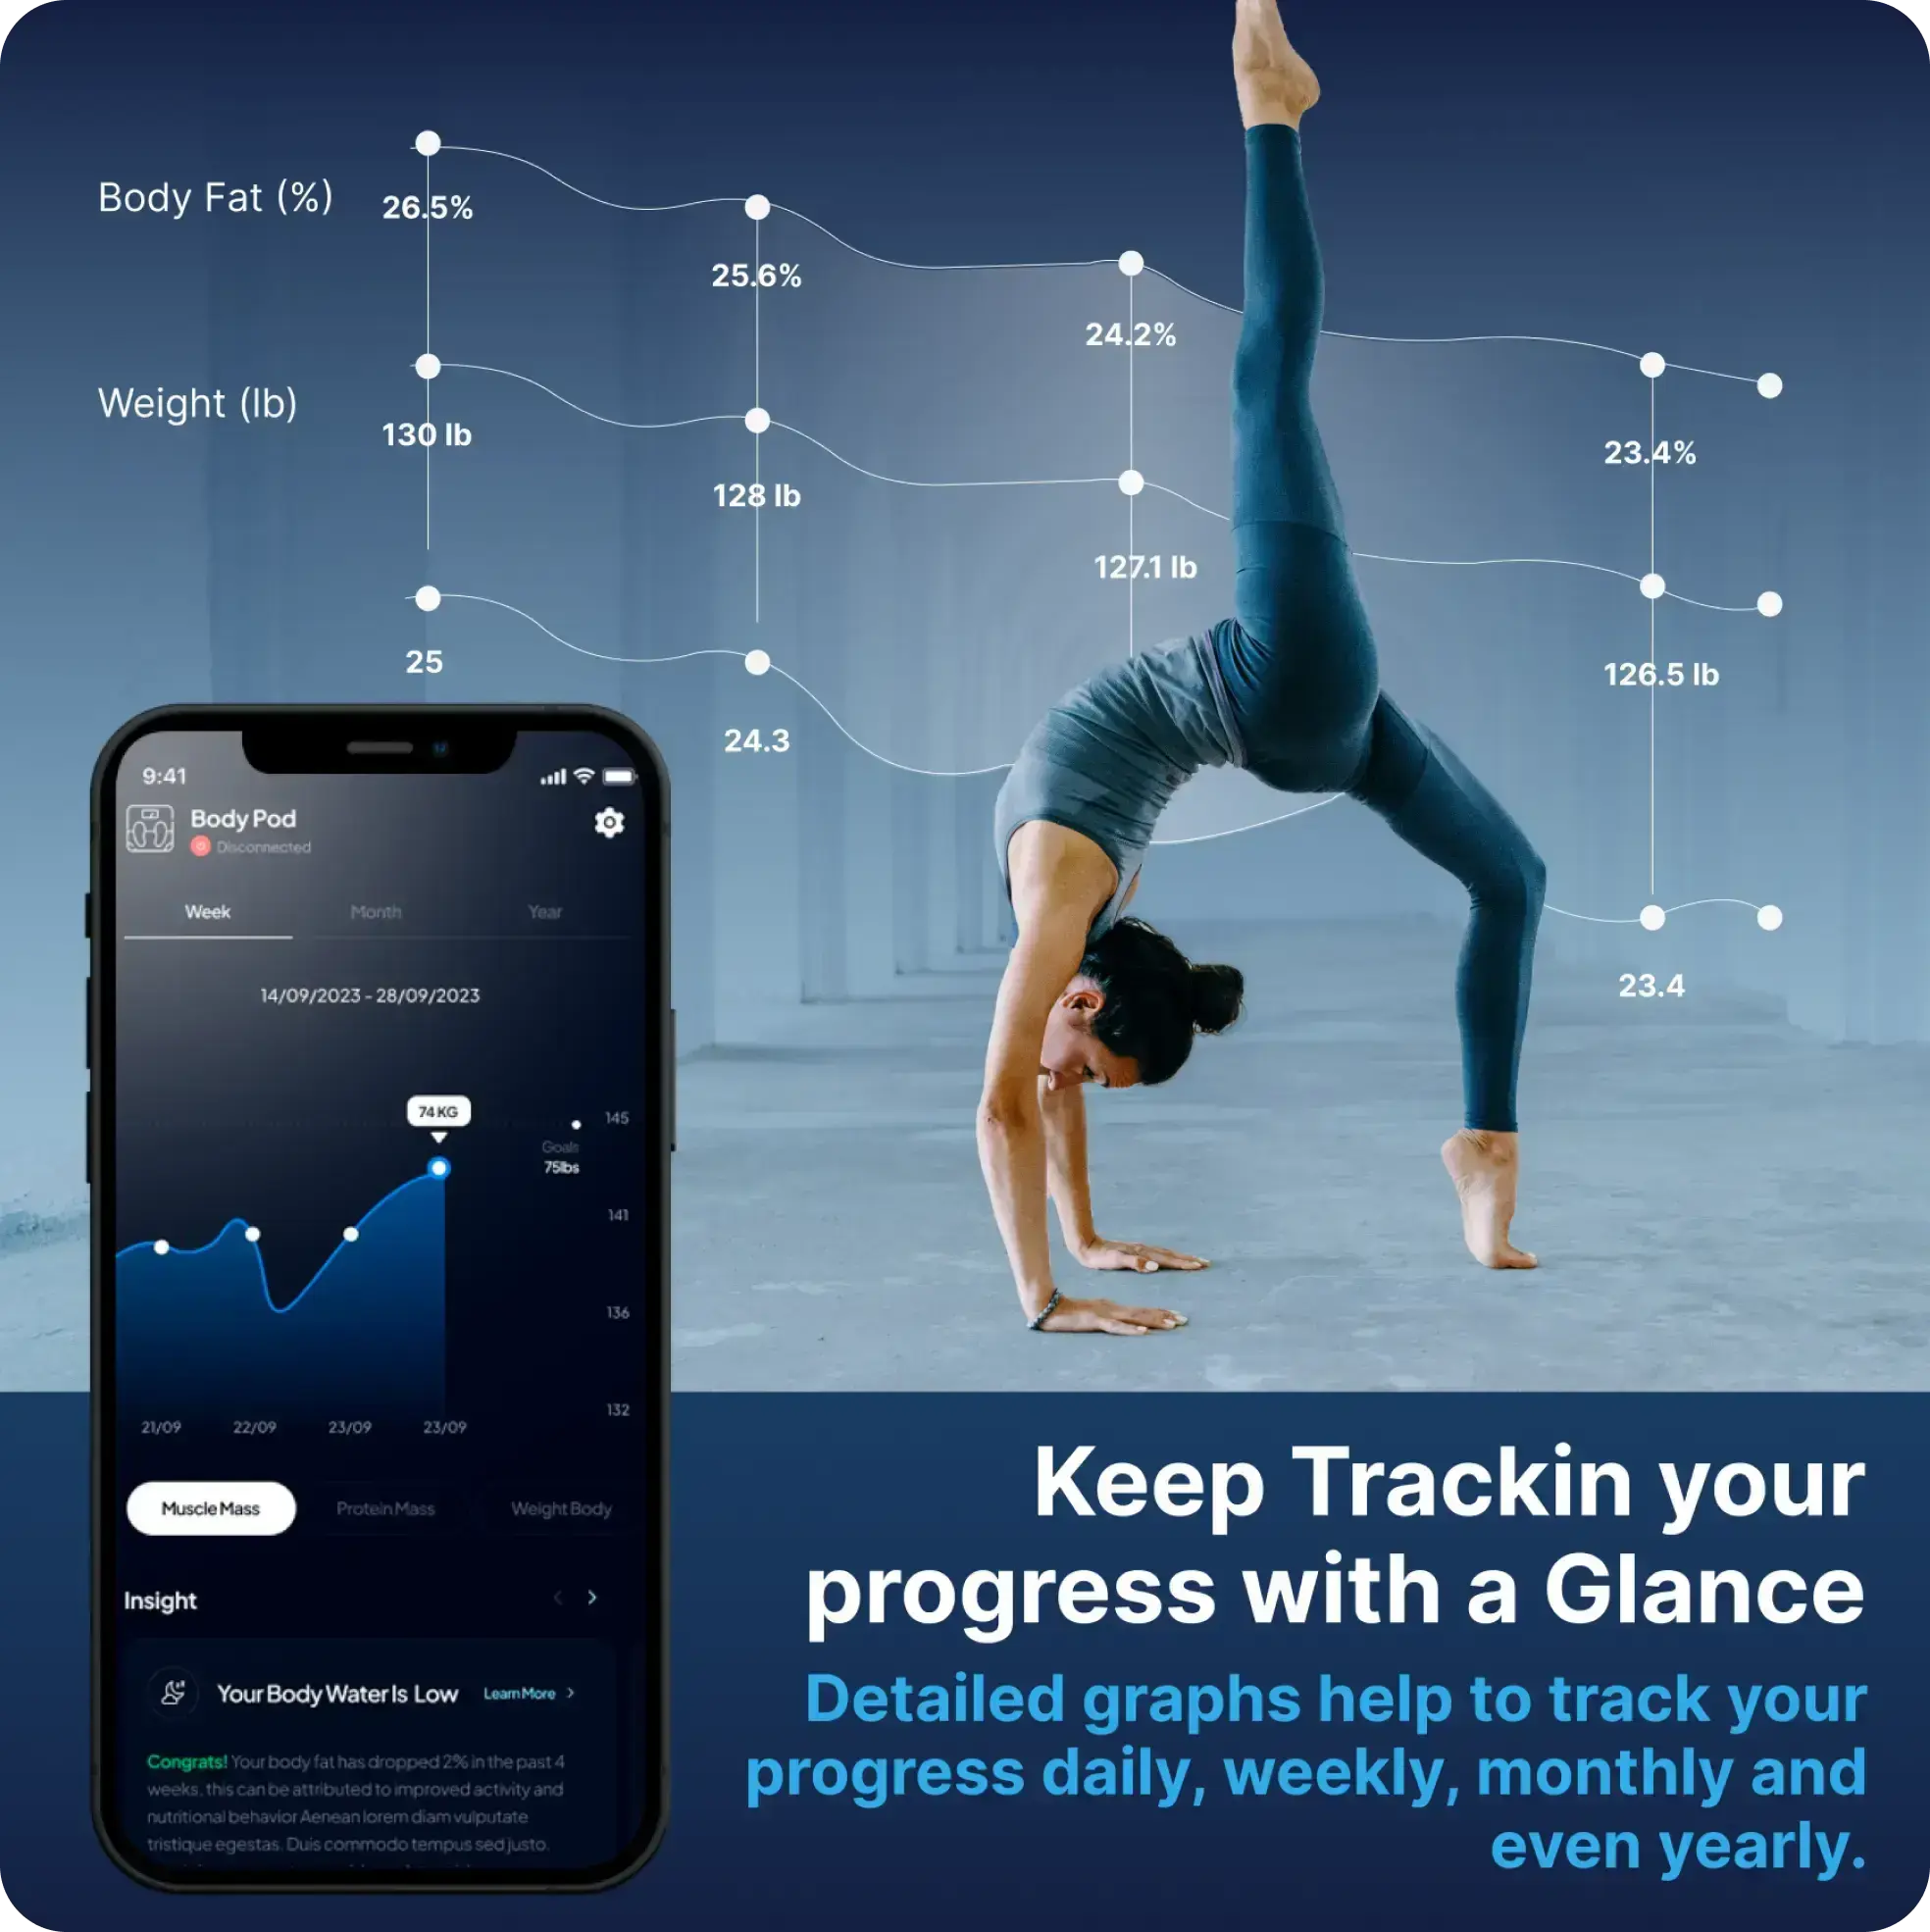
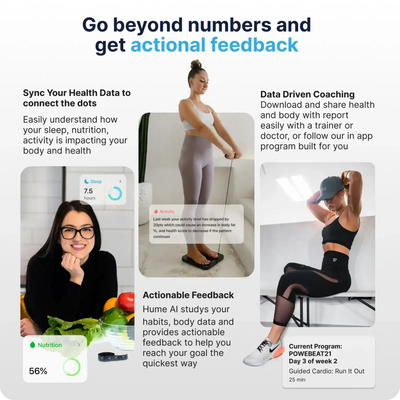
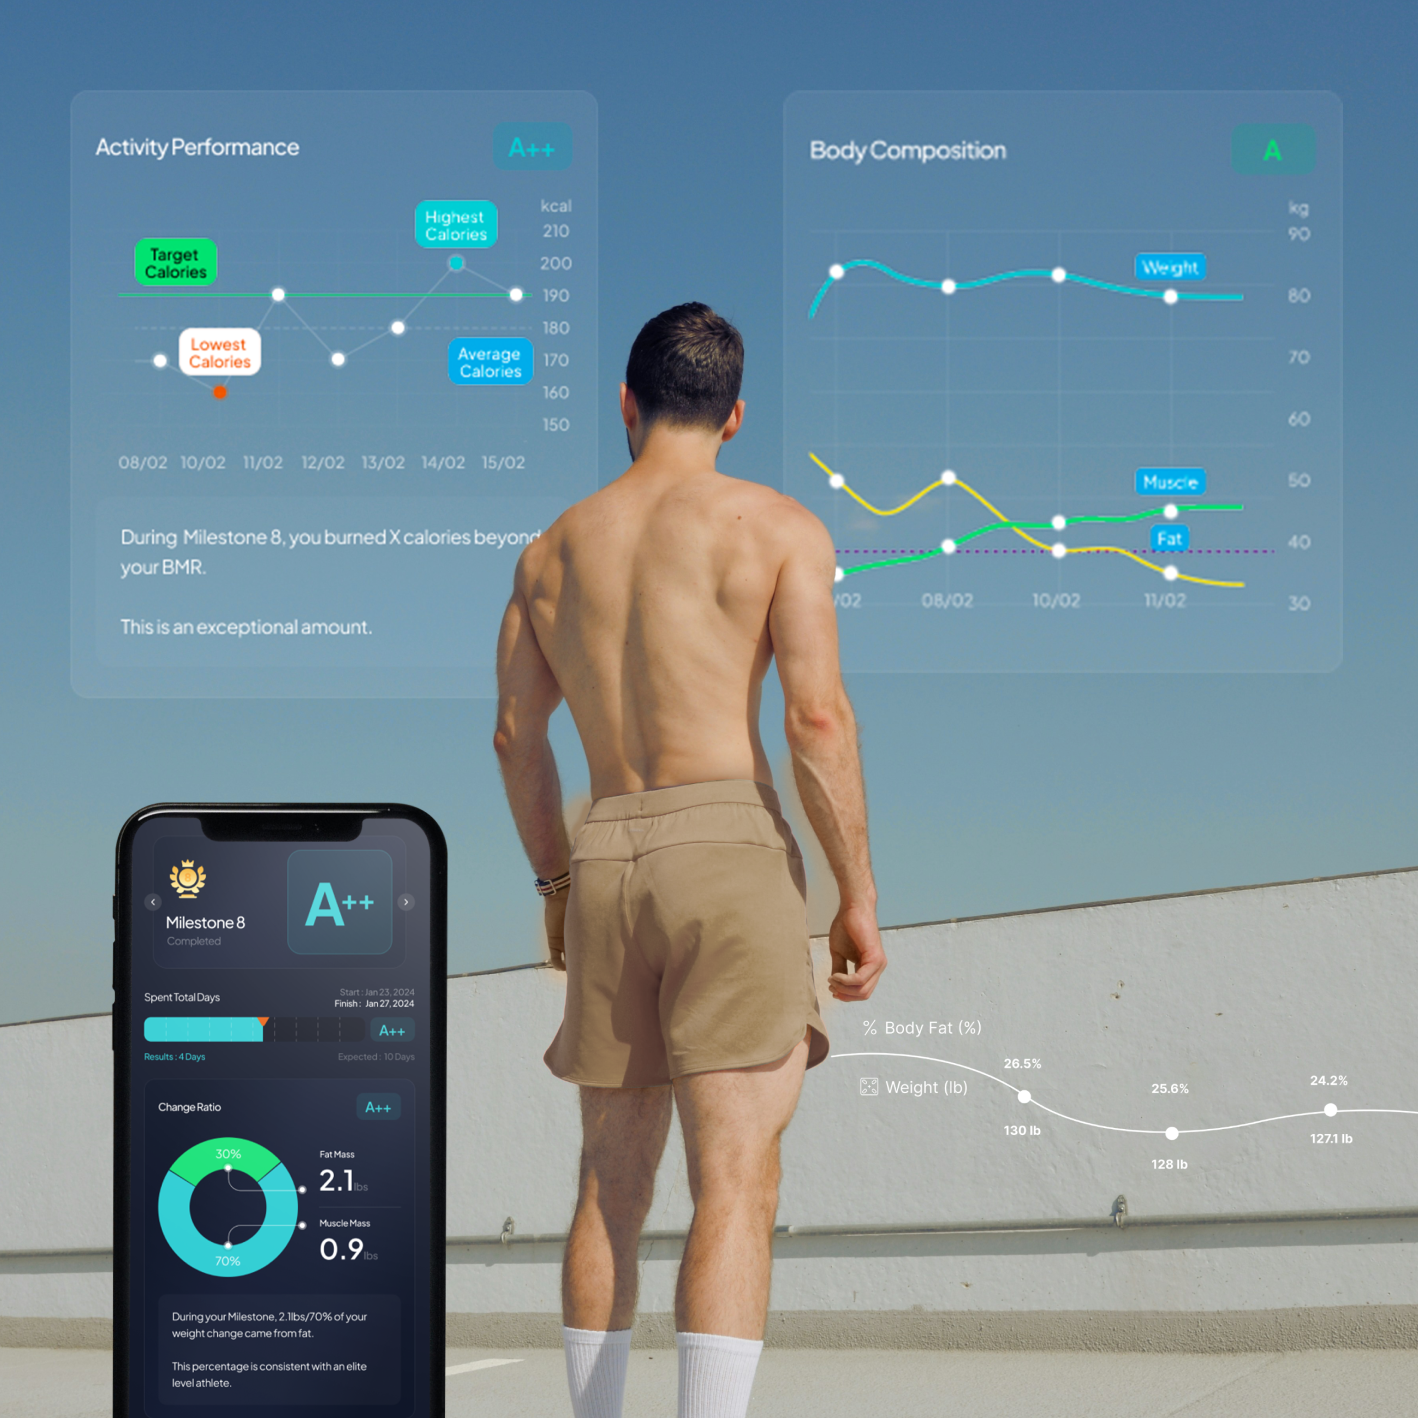
Set goals. Track progress. Celebrate victories. Users who track their progress reach their health goals 8x faster. No wonder 83% of Hume Health users hit their weight goals in 6 months—imagine reaching yours even faster!
Results you can trust
No More Guessing
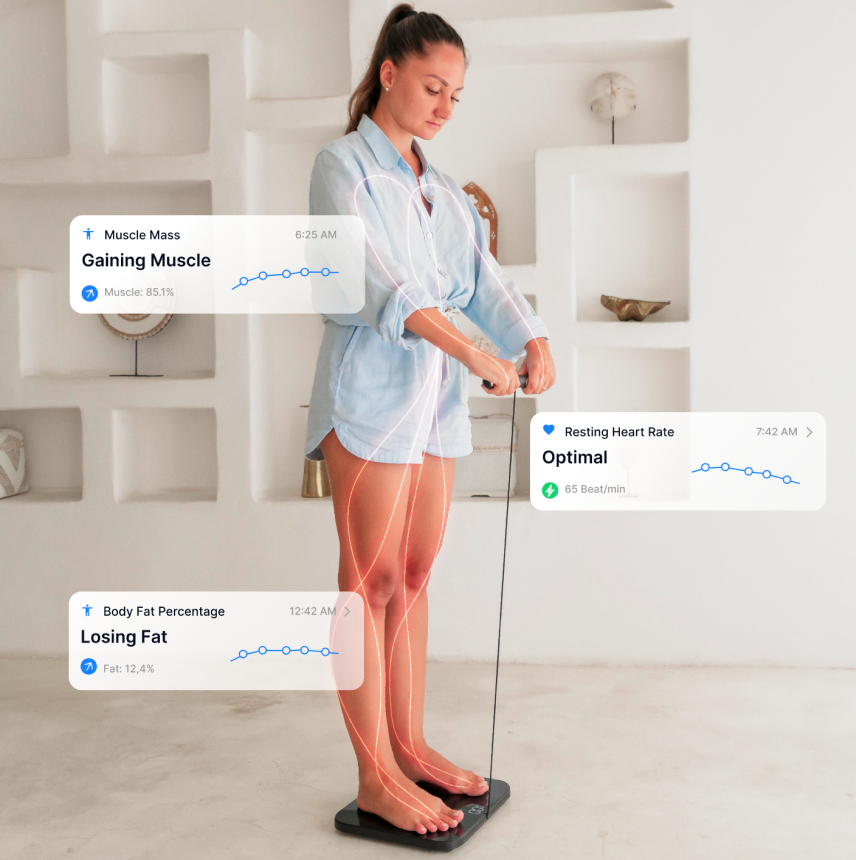
The Hume Pod doesn’t just track; it translates your data into powerful insights. Understand how your diet, sleep, and daily choices impact your health. Think of it as your personal GPS, guiding you on the fastest route to your individual health goals for easy and effective weight loss.
Results you can trust
Perfect for a family
We know tracking your loved ones’ health can be tough. The Hume Pod is designed for family sharing—register up to 24 users and monitor them independently. It’s free and easy to use. Keep your family healthy with powerful data at your fingertips

Results you can trust
Measure your heart health
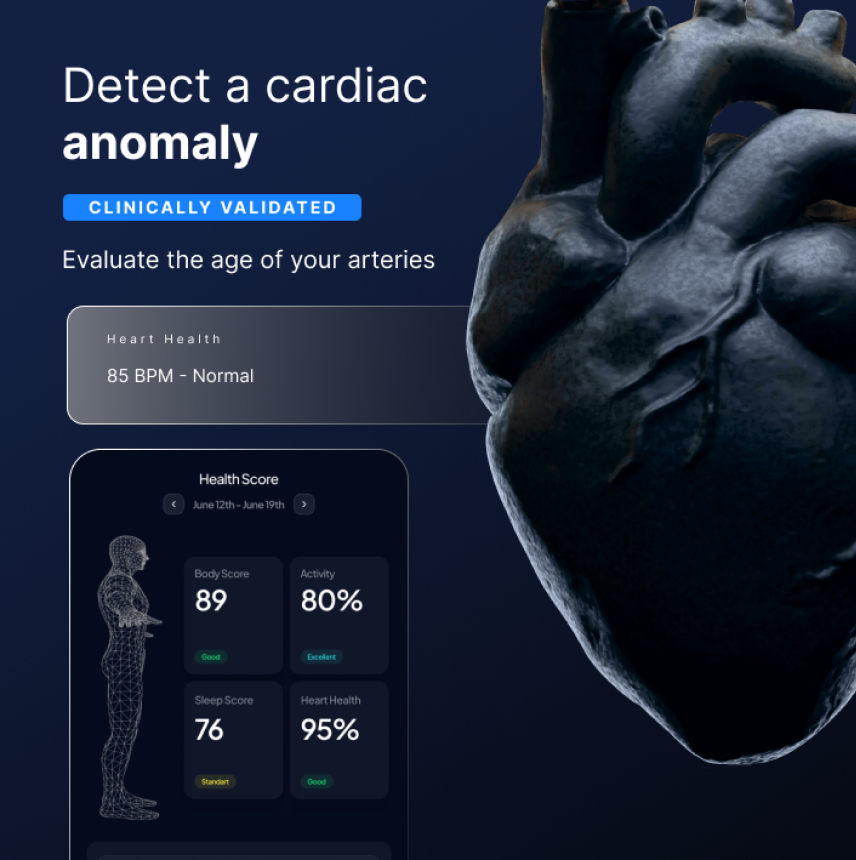
Our smart scale goes beyond weight—it tracks your heart rate, giving you vital insights into your cardiovascular health. With every weigh-in, monitor changes in your heart’s performance and stay on top of your fitness goals. It’s the simplest way to keep your heart health in check, right from home.
Results you can trust
It’s Vetted By Athletes and Pro Trainers
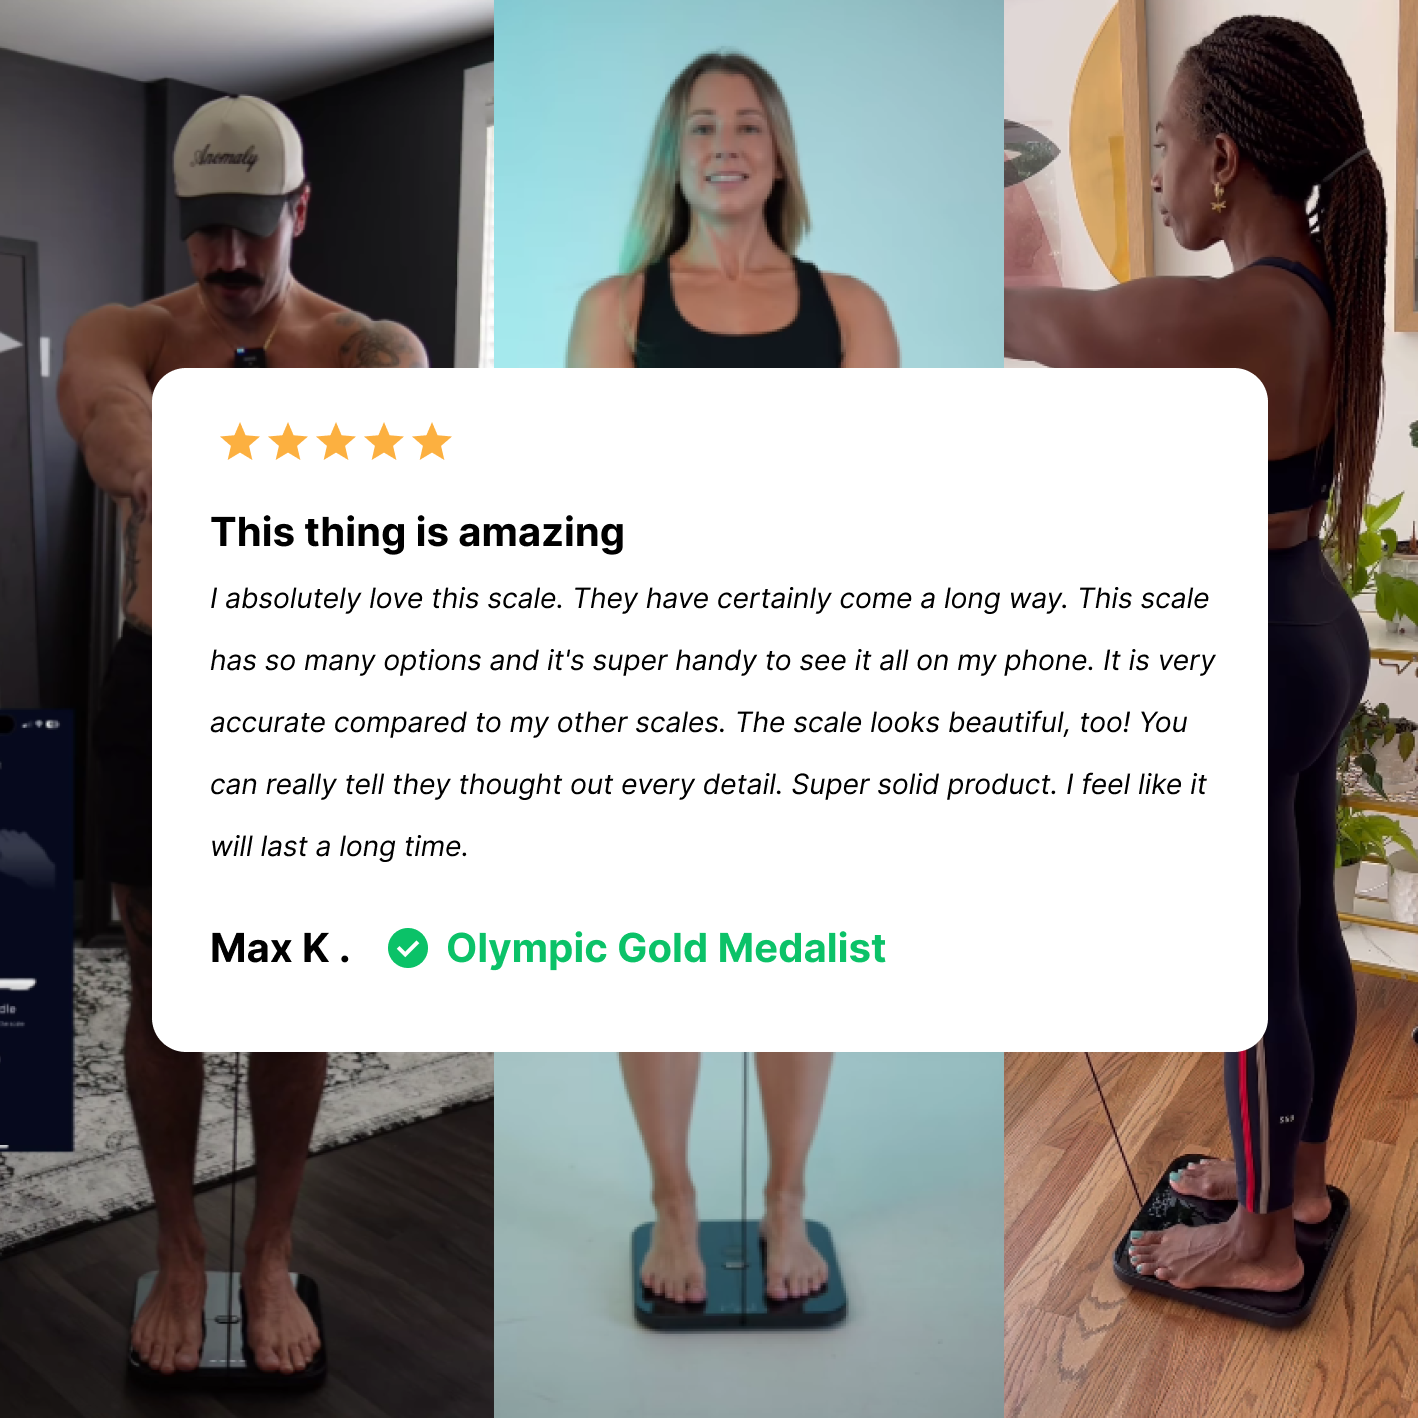
There is a reason why the #1 choice for professionals all across the world. It is used in leading weight loss clinics and gyms for it’s accuracy and reliability. With its user-friendly design, the Hume Pod enhances accountability and helps clients achieve their health goals effectively....You should put it to the test as well...
All data in one place
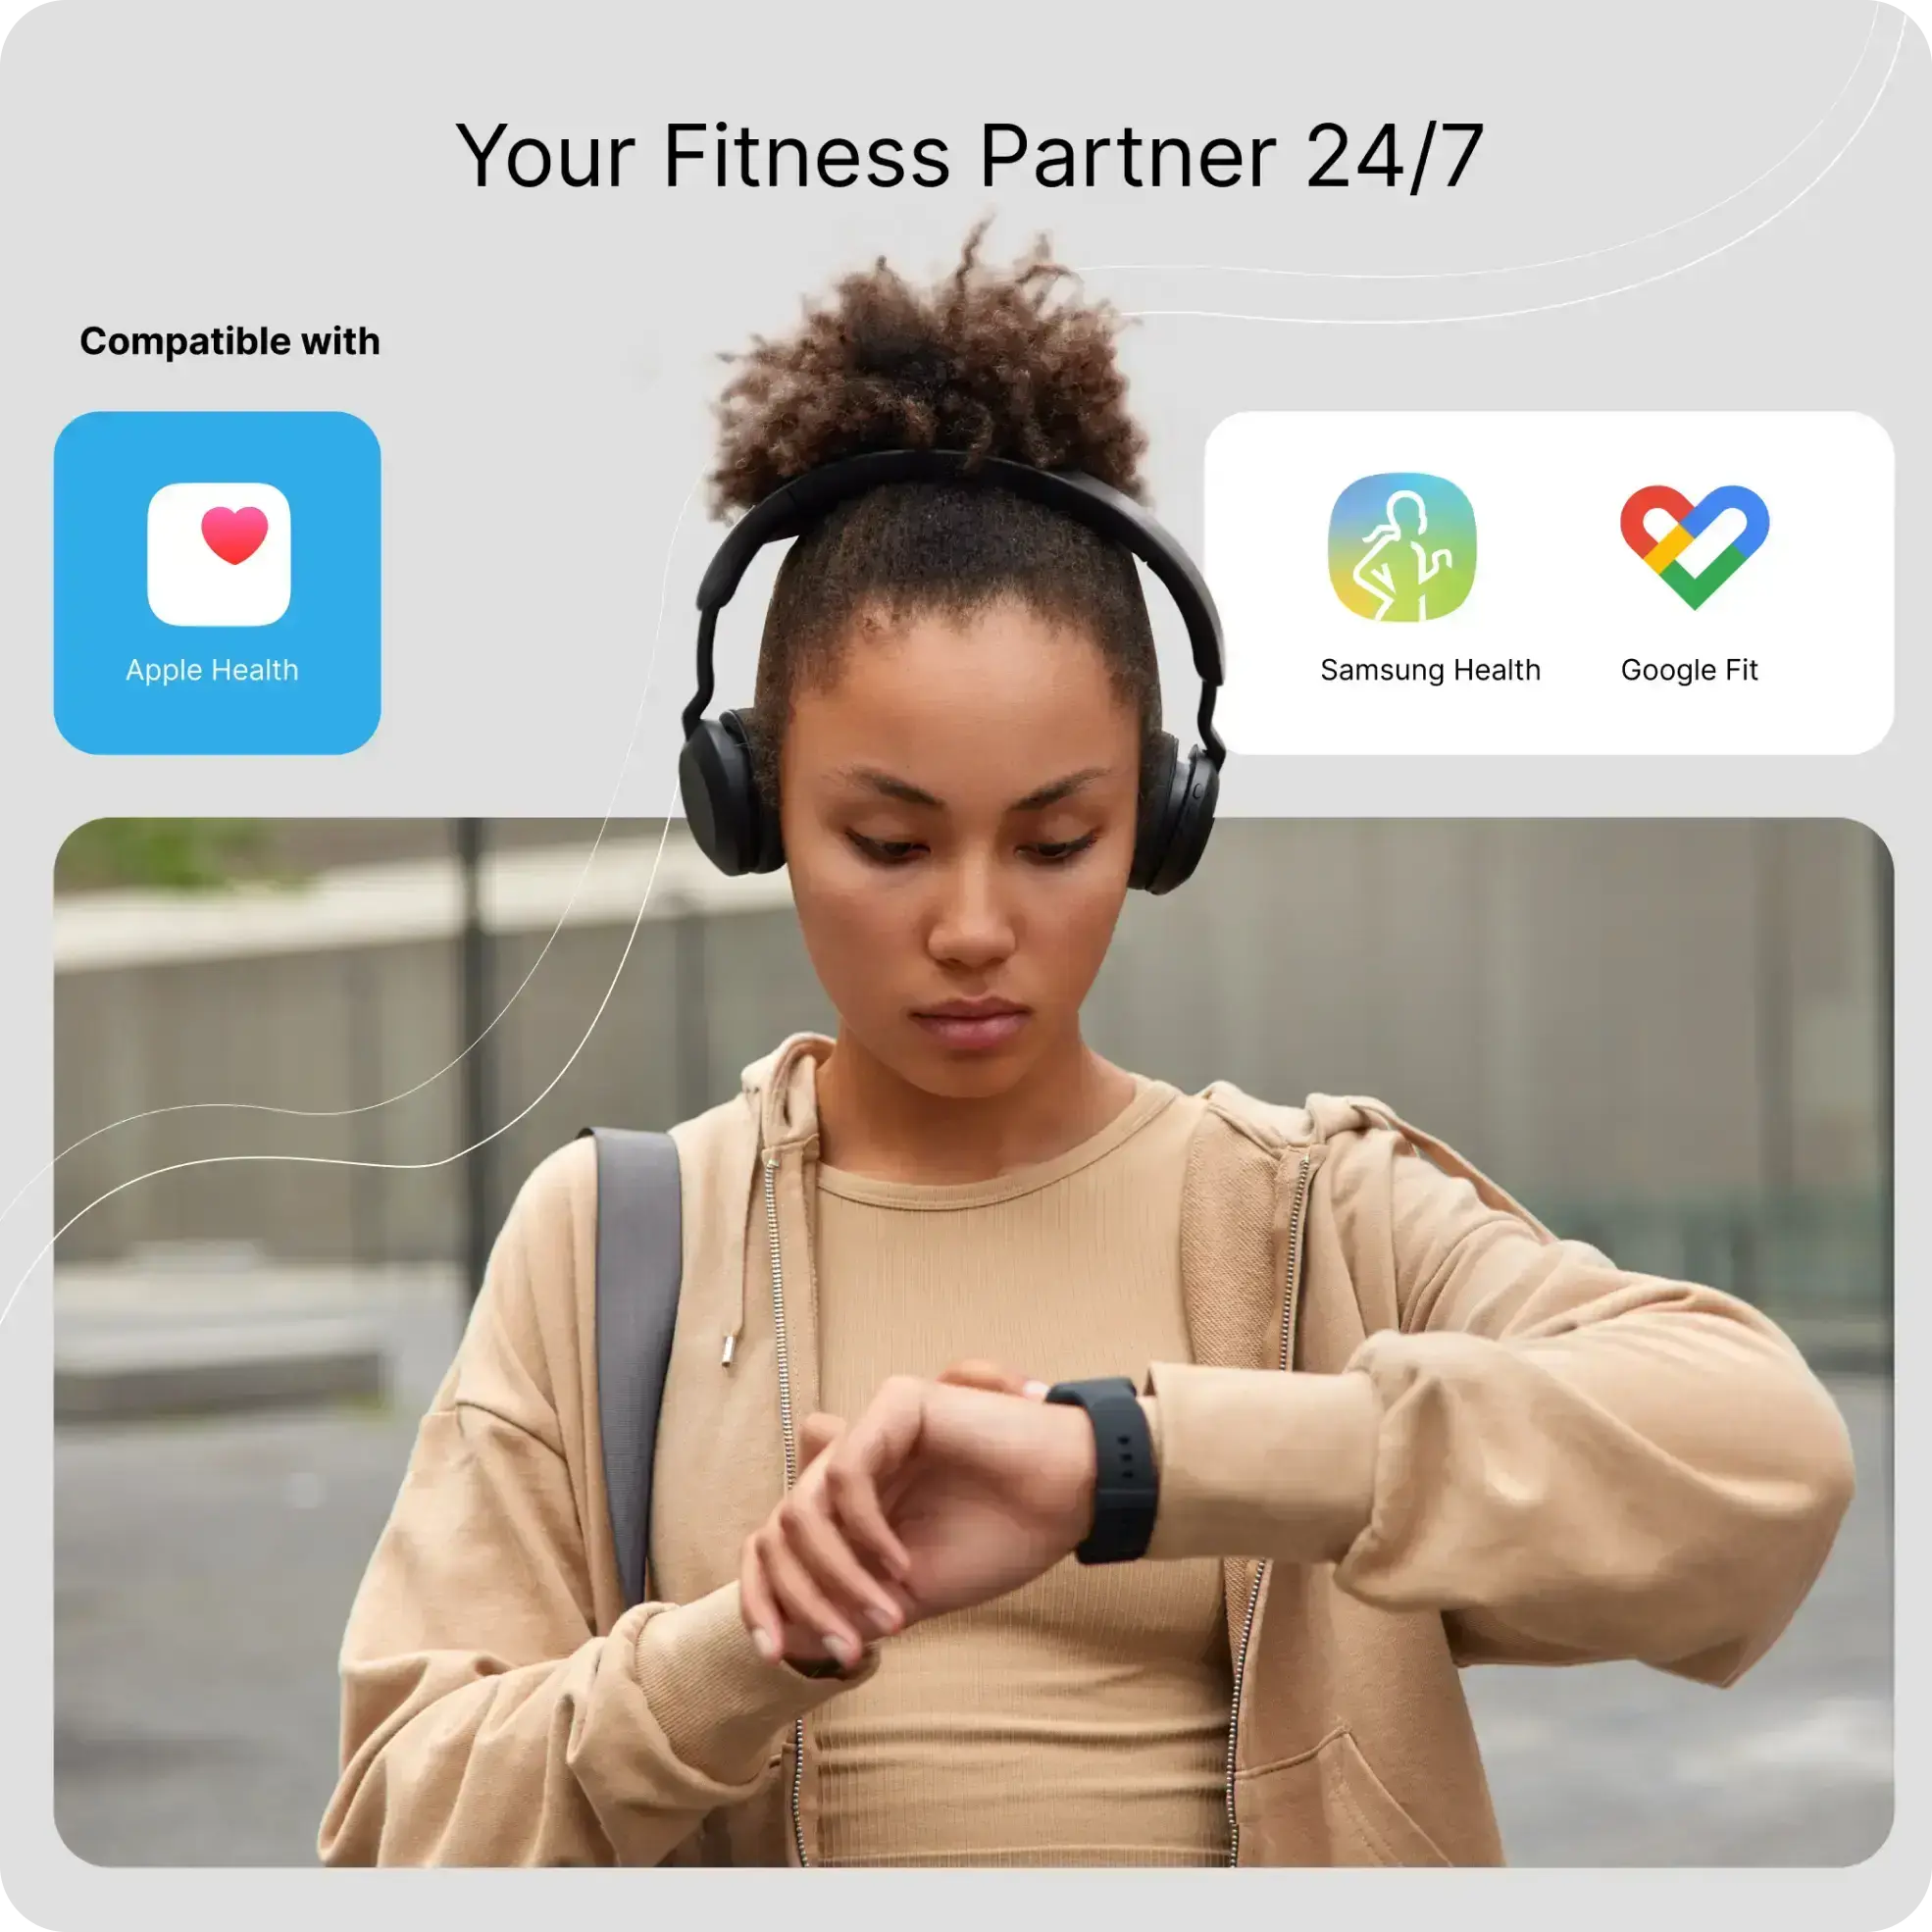
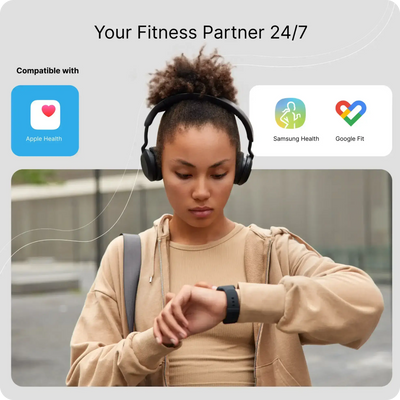
Easily connect with health apps
Seamlessly sync your data with apple health, google fit and samsung health for a comprehensive view of your health journey. Stay motivated and informed as you take charge of your wellness with a body analyzer that fits your digital lifestyle!

Results you can trust
Worldwide Shipping
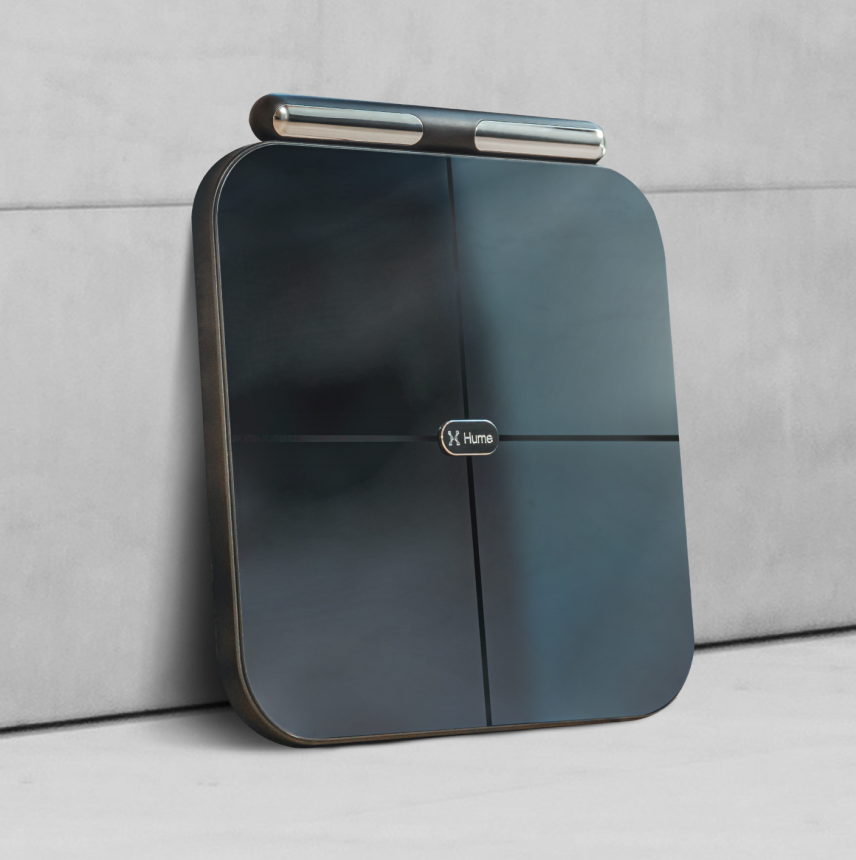
We offer free express shipping from our headquarters just east of San Francisco in Benicia, California. We take great pride in handling all of our own research and development, design, manufacturing, shipping and customer service.
Results you can trust
45 Days Trial
Try our smart scale risk-free with a 45-day trial. We’re so confident you’ll love it, we’re giving you two full months to try it out. Track your weight, heart rate, and body composition, and see real results. If you’re not satisfied, return it—no questions asked. Your health, your way, with zero commitment.

Results you can trust
Support up to 400lbs
Our smart scale supports up to 400 lbs, making it perfect for users of all sizes. Track your health metrics confidently with accurate data that supports your weight loss or fitness journey. Invest in the Hume Pod that grows with you and helps you reach your goals
Results you can trust
Technical Specifications
Our smart scale supports up to 400 lbs, making it perfect for users of all sizes. Track your health metrics confidently with accurate data that supports your weight loss or fitness journey. Invest in the Hume Pod that grows with you and helps you reach your goals

Results you can trust
Fast Charging
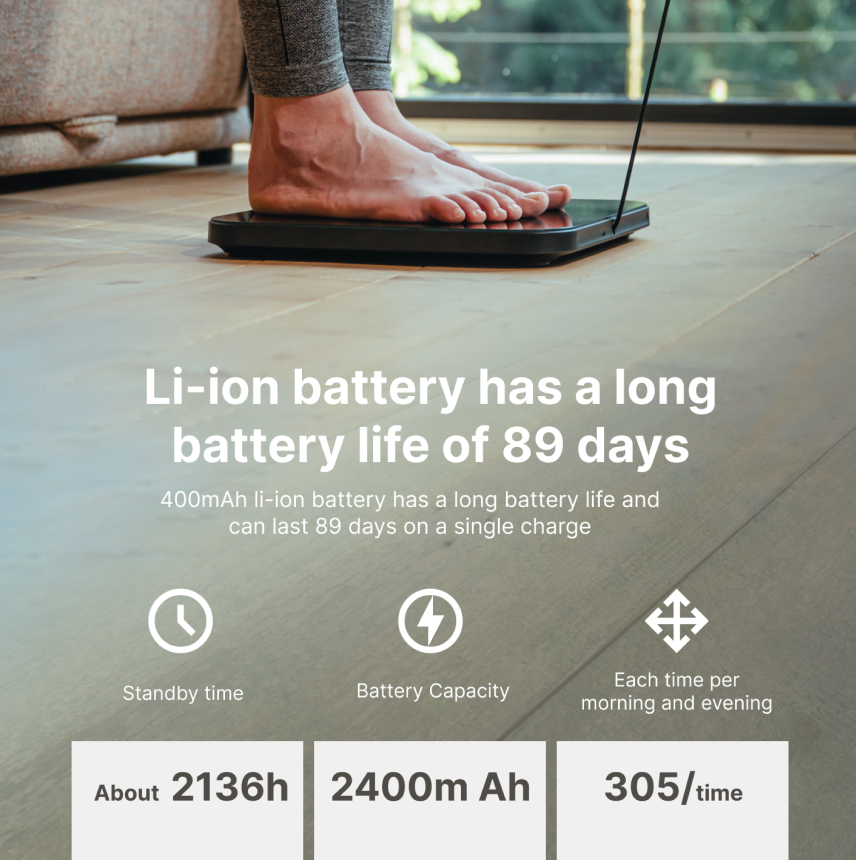
Enjoy the convenience of our smart scale with a rechargeable battery that lasts an impressive 90 days on a single charge! Need a quick boost? It charges in just 30 seconds, ensuring hassle-free tracking of your health metrics. Stay on top of your goals with a scale designed for your busy lifestyle!
Join a Supportive Community
of Over 1.2 Million Users
of Over 1.2 Million Users
Customer Reviews
4.9 Based on 2,130 Reviews
Write a Review Ask a Question Frequently Asked Questions
Does the Hume Pod Actually Work?
Yes—our Hume Pod is built on science. Our products are grounded in research and tested against medical-grade devices. In an independent study conducted by Socotech, the Hume Pod was shown to be within ±3% accuracy of a DEXA scan—the gold standard for body composition measurement.
We’re so confident in our accuracy and results that we offer a 45-day no-questions-asked trial and return policy. Try it for yourself and feel the difference.
Is the app free?
Yes! A Premium subscription is not required to use your scale. You can still enjoy the Hume Health app for free and access essential features like weighing-in and viewing body measurements.
However, certain advanced features are reserved for Premium (Hume Plus) users, including:
•A comprehensive weekly Health Report that examines:
Body Composition
Activity
Sleep
•Personalized health insights & recommendations to achieve your goals
•And so much more!
Can it be used by multiple users?
Yes! The Hume Pod can connect to multiple accounts. Each user should log in with their own Hume Account for accurate tracking.
Like all Bluetooth devices, the Hume Pod can only connect to one phone at a time. To weigh in, simply open your Hume Health App and step on the scale. However, if another paired user is nearby with their app open, they may need to close their app to free up the Hume Pod’s connection for you
Are these technologies safe?
Yes—the Hume Pod’s BIA (Bioelectrical Impedance Analysis) technology is completely safe and has been widely used for over 20 years. What sets us apart is our patented BIA frequency, which allows for greater accuracy compared to other smart Hume Pods.
For customers with cardiac devices like pacemakers or ICDs implanted after 1992, our Hume Pod is safe to use. Multiple studies have shown no interference with CIEDs (Cardiac Implantable Electronic Devices) during BIA measurements.
Your safety and trust are our top priorities—and our technology reflects that.
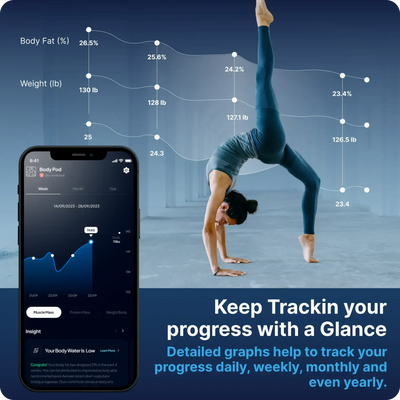
Does it show weekly trends on graph?
Yes! Hume tracks your progress over time and displays your data in easy-to-read graphs. You can view your weekly, monthly, and yearly averages for weight and other key health metrics. This makes it simple to spot trends, track your progress, and stay motivated on your health journey.
What Does my Warranty Cover?
1-Year Warranty
Think of this as your Hume safety net. If your device ever runs into a hiccup due to a product defect—like a sensor glitch or anything not working the way it should—we’re on it. Just give us a shout, and we’ll send you a free replacement to keep things running smoothly. No stress, no fuss, just support when you need it.
10-Year Warranty
Go long—like really long—with our 10-year warranty. It covers the same product defect protection as our 1-year plan, but for a whole decade. If your device ever stops working as expected due to a defect, we’ll replace it for free. And if it ever happens again? Your second replacement is 50% off. It’s peace of mind for the long haul, with a little bonus built in.
If I don't like it? Can I return it?
Absolutely! We’re confident you’ll love your Hume product—but if it’s not the right fit, no worries. That’s why we offer a 45-day trial so you can try it out, commitment-free. If you decide to return it, just reach out to our customer service team first. They’ll share the return instructions—and once you ship it back to us, we’ll take it from there.
What is the maximum weight?
The scale supports a maximum weight of 400 lbs (181.4 kg). If exceeded, the scale will display an error. The scale has a minimum measure weights of 6.6 lbs (3 kg).
Weighing-in for the first time?
Place your scale on an uncarpeted, flat surface.
Ensure your phone’s bluetooth is active.
With bare feet (no socks) step onto your scale until it displays 0.00.
If your scale is not turning on, please place it on charge.
Open the Hume Health App and tap “measurement”. Select the Hume Pod available from the list of devices.
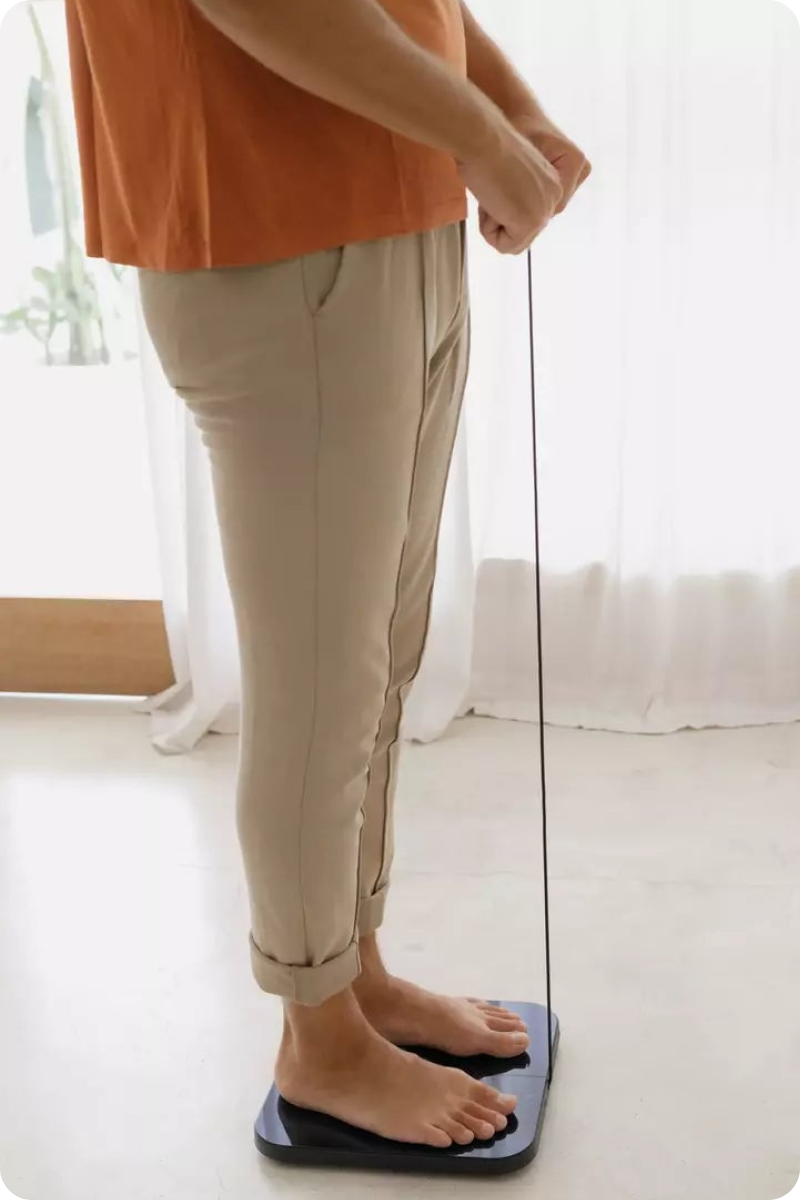
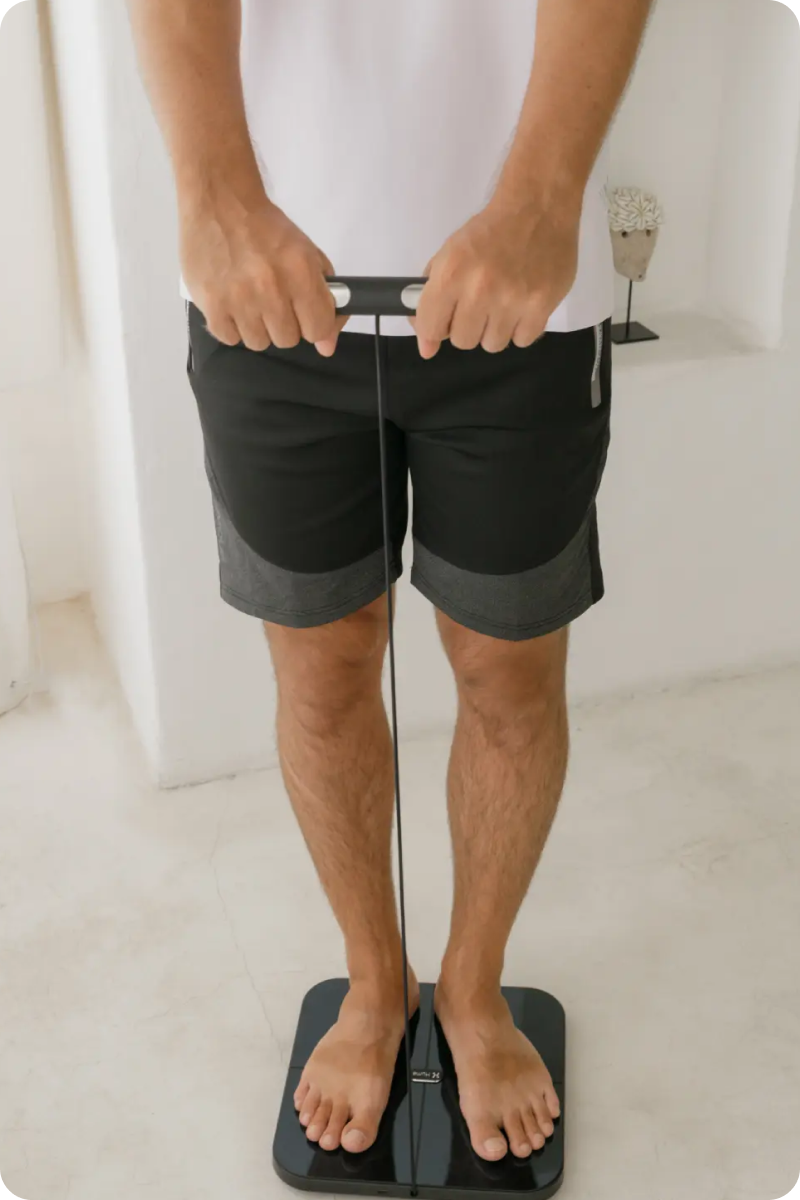
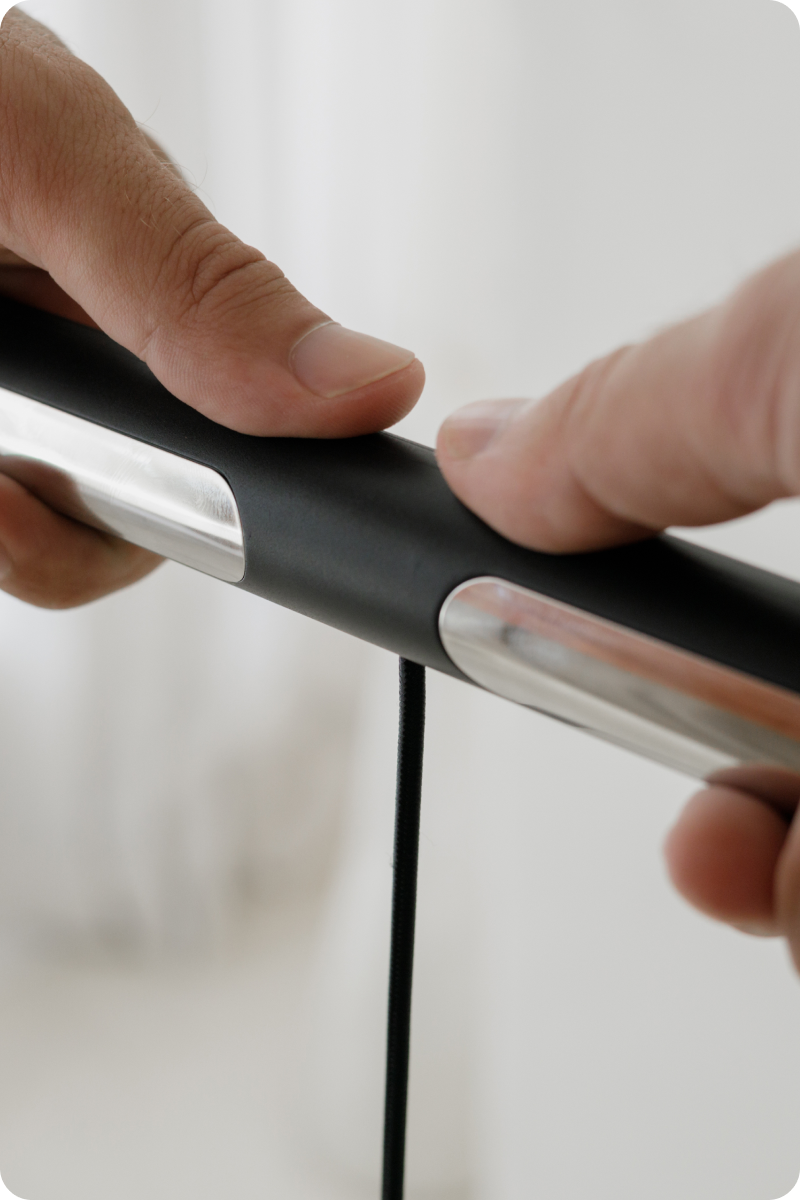
Pull, and while standing fully upright facing forward, hold the Hume Pod handles steady with both hands.
Remain in place, upright on the scale holding both handles steady, until the Hume Health app signals that your weigh-in is complete.Checklist:
- Uncarpeted, flat surface
- Standing upright, barefoot
- Holding the handles steady at waist height
- Wait for your Hume Health app to notify that your weigh in is complete
How to get the best results?
Start your day with a morning weigh-in for consistent tracking, minimizing daily fluctuations influenced by meals and fluids.
Try to keep the same time and place for your weigh-ins
Remember: Weight can vary day to day and even hour to hour. It is important to focus on trends. By focusing on these trends you get a clever picture of your progress and patterns.
Stay flexible, don’t skip a day, just do it later!